Grok
Nigerian Companies with Market Capitalization Exceeding ₦1 Trillion
Introduction
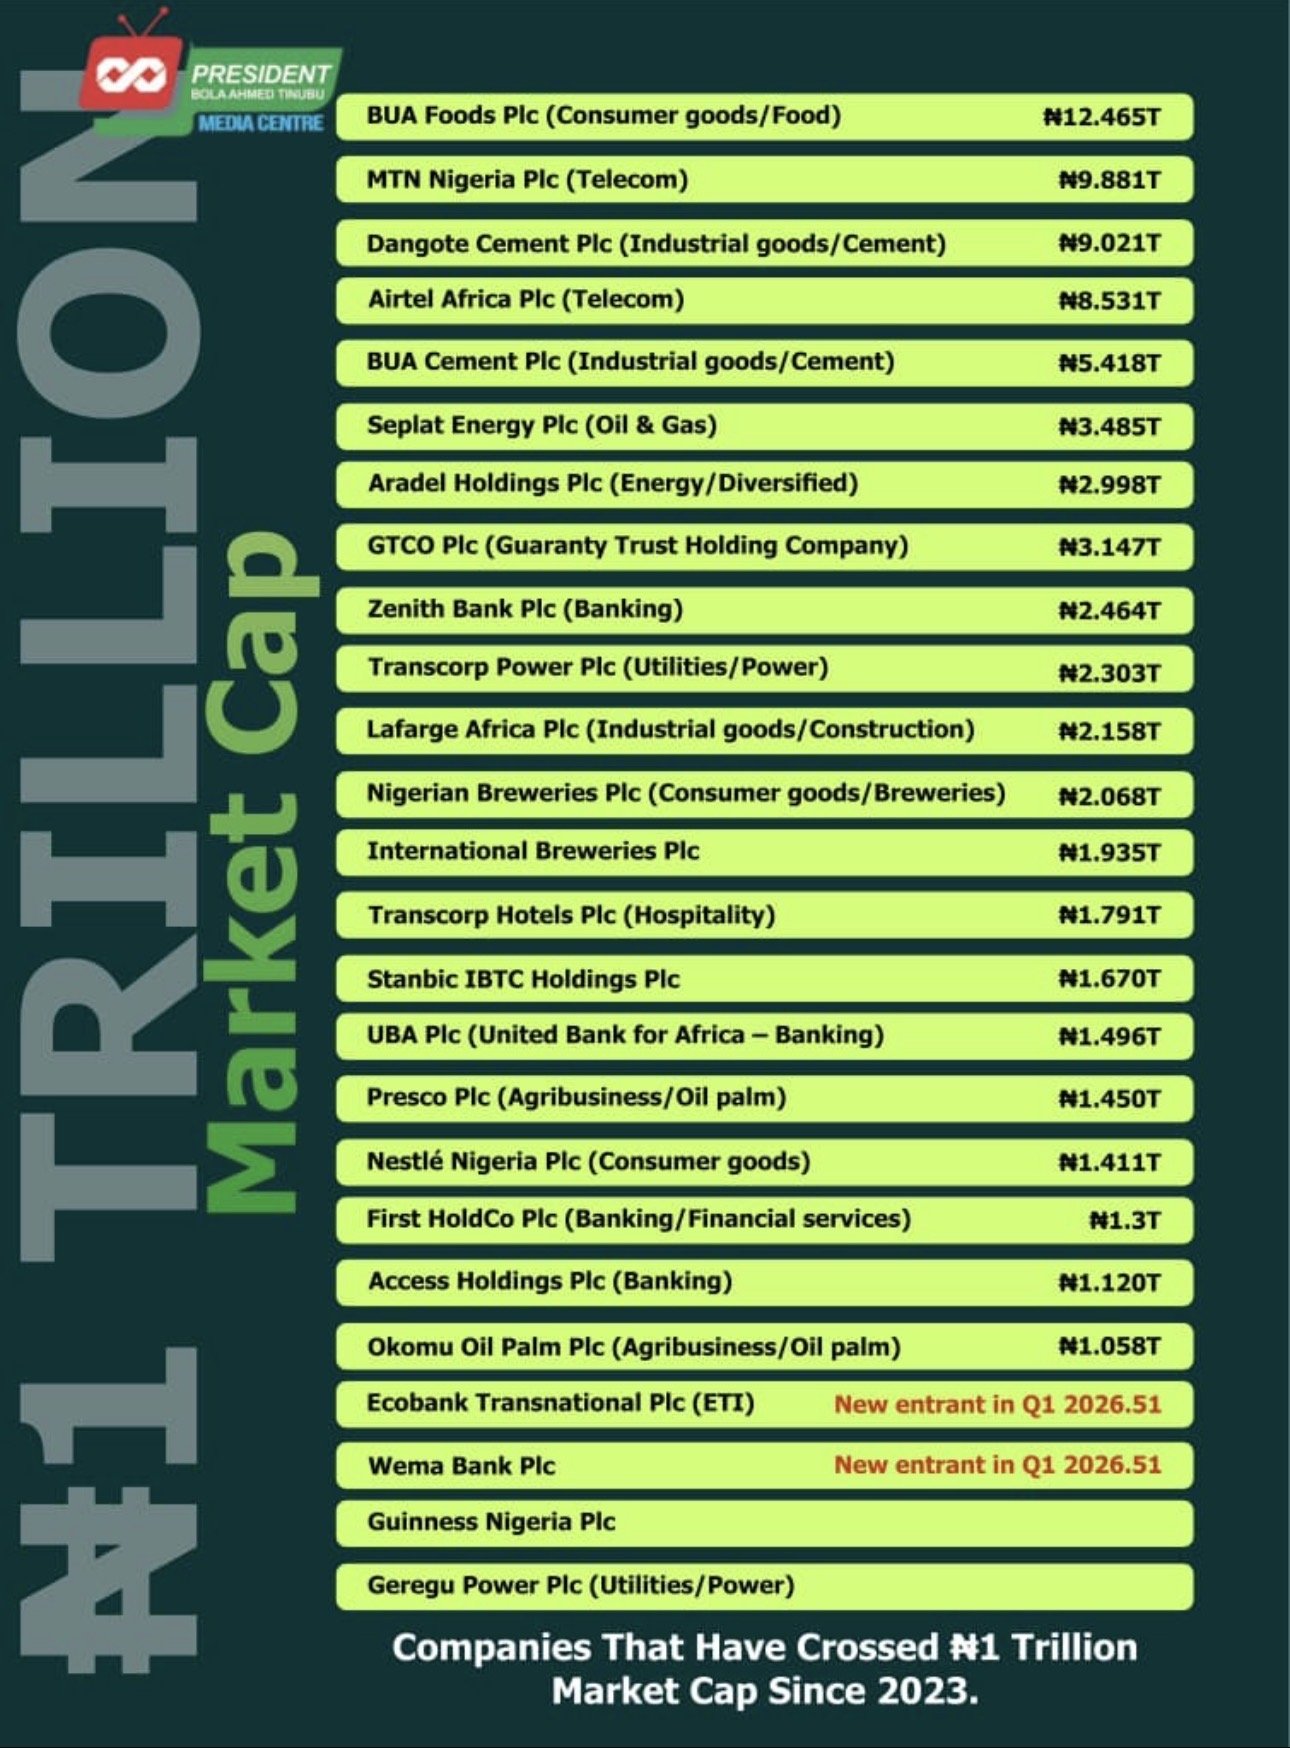
The following analysis presents a structured overview of Nigerian companies that have achieved a market capitalization surpassing ₦1 trillion since 2023, based on data as of early 2026. The original nominal values in Nigerian Naira (₦) trillions are re-presented across multiple comparative dimensions to facilitate a comprehensive professional discourse.
Four columns are provided for each company:
- As is: Original nominal market capitalization in ₦ trillions.
- 2026 Current USD: Converted using the prevailing April 2026 exchange rate of approximately ₦1,343 per USD.
- 2022 USD (constant terms, approximate): Adjusted for cumulative inflation from end-2022 to early 2026 (estimated factor of approximately 2.1–2.3×, reflecting annual rates averaging 20–30% in prior years before moderating to around 15% in 2026), then converted at the 2022 average exchange rate of approximately ₦425 per USD. This offers an indicative real-term equivalent in 2022 purchasing power expressed in USD.
- PPP (Billion Intl. $): Converted using Nigeria’s implied PPP conversion factor of approximately 218 NGN per international dollar (based on recent IMF estimates). This metric reflects the companies’ economic scale within the domestic price environment.
Notes on Methodology: Conversions are indicative and rely on point-in-time market data and macroeconomic aggregates. Market capitalizations are snapshots and subject to fluctuation. New entrants are explicitly noted. Precise valuation dates and sector-specific adjustments may refine these figures further.
Tabulated Representation
| Rank (approx.) |
Company Name (Sector) |
As is (₦ Trillion) |
2026 Current USD (Billion) |
2022 USD (Billion, approx. constant) |
PPP (Billion Intl. $) |
| 1 |
BUA Foods Plc (Consumer goods/Food) |
12.465 |
9.28 |
4.0 – 4.4 |
57.2 |
| 2 |
MTN Nigeria Plc (Telecom) |
9.881 |
7.36 |
3.2 – 3.5 |
45.3 |
| 3 |
Dangote Cement Plc (Industrial goods/Cement) |
9.021 |
6.72 |
2.9 – 3.2 |
41.4 |
| 4 |
Airtel Africa Plc (Telecom) |
8.531 |
6.35 |
2.8 – 3.0 |
39.1 |
| 5 |
BUA Cement Plc (Industrial goods/Cement) |
5.418 |
4.03 |
1.7 – 1.9 |
24.9 |
| 6 |
Seplat Energy Plc (Oil & Gas) |
3.485 |
2.59 |
1.1 – 1.2 |
16.0 |
| 7 |
GTCO Plc (Guaranty Trust Holding Company) |
3.147 |
2.34 |
1.0 – 1.1 |
14.4 |
| 8 |
Aradel Holdings Plc (Energy/Diversified) |
2.998 |
2.23 |
1.0 |
13.8 |
| 9 |
Zenith Bank Plc (Banking) |
2.464 |
1.84 |
0.8 |
11.3 |
| 10 |
Transcorp Power Plc (Utilities/Power) |
2.303 |
1.71 |
0.7 – 0.8 |
10.6 |
| 11 |
Lafarge Africa Plc (Industrial goods/Construction) |
2.158 |
1.61 |
0.7 |
9.9 |
| 12 |
Nigerian Breweries Plc (Consumer goods/Breweries) |
2.068 |
1.54 |
0.7 |
9.5 |
| 13 |
International Breweries Plc |
1.935 |
1.44 |
0.6 |
8.9 |
| 14 |
Transcorp Hotels Plc (Hospitality) |
1.791 |
1.33 |
0.6 |
8.2 |
| 15 |
Stanbic IBTC Holdings Plc |
1.670 |
1.24 |
0.5 – 0.6 |
7.7 |
| 16 |
UBA Plc (Banking) |
1.496 |
1.11 |
0.5 |
6.9 |
| 17 |
Presco Plc (Agribusiness/Oil palm) |
1.450 |
1.08 |
0.5 |
6.7 |
| 18 |
Nestlé Nigeria Plc (Consumer goods) |
1.411 |
1.05 |
0.5 |
6.5 |
| 19 |
First HoldCo Plc (Banking/Financial services) |
1.300 |
0.97 |
0.4 |
6.0 |
| 20 |
Access Holdings Plc (Banking) |
1.120 |
0.83 |
0.4 |
5.1 |
| 21 |
Okomu Oil Palm Plc (Agribusiness/Oil palm) |
1.058 |
0.79 |
0.3 – 0.4 |
4.9 |
| – |
Ecobank Transnational Plc (ETI) (New entrant Q1 2026) |
>1.0 |
>0.74 |
>0.3 |
>4.6 |
| – |
Wema Bank Plc (New entrant Q1 2026) |
>1.0 |
>0.74 |
>0.3 |
>4.6 |
| – |
Guinness Nigeria Plc |
>1.0 |
>0.74 |
>0.3 |
>4.6 |
| – |
Geregu Power Plc (Utilities/Power) |
>1.0 |
>0.74 |
>0.3 |
>4.6 |
Analytical Observations
The nominal ₦ figures illustrate notable expansion in Nigeria’s equity market, with over 20 companies now exceeding the ₦1 trillion threshold. This growth is particularly concentrated in consumer goods, telecommunications, cement, and banking sectors, which benefit from essential demand, scale advantages, and established market positions.
Conversion to 2026 current USD reveals a significant contraction attributable to Naira depreciation. The leading entity, BUA Foods Plc, equates to approximately $9.3 billion, while the majority of listed companies fall within the $1–7 billion range. This adjustment underscores the reduced international comparability resulting from currency movements.
Further adjustment to approximate constant 2022 USD terms moderates the valuations even more, accounting for the cumulative impact of inflation over the intervening period. These real-term figures indicate that a substantial portion of nominal growth has been offset by domestic price pressures, resulting in more modest outcomes when measured against a stable pre-surge baseline.
In Purchasing Power Parity (PPP) terms, the figures appear larger, as this approach incorporates Nigeria’s lower domestic price levels for non-tradable goods and services. Consequently, the companies demonstrate greater economic weight within the local context, although this metric does not fully address considerations relevant to foreign investors or operations involving imported inputs.
Sectoral leadership remains with telecommunications and consumer staples, followed by industrial goods and financial services. The entry of new participants in Q1 2026 reflects broadening market participation and ongoing maturation of Nigeria’s capital markets.
Broader Implications
Achievement of trillion-naira market capitalizations constitutes a significant milestone in the development of Nigeria’s financial ecosystem. However, adjustments for exchange rates, inflation, and purchasing power present a more nuanced perspective. Sustained real economic value creation would be enhanced by continued moderation of inflation, greater currency stability, and improvements in underlying productivity and governance frameworks.
These adjusted metrics are essential for cross-temporal comparisons, international benchmarking, and informed decision-making among investors, policymakers, and analysts. The concentration of value among a select group of companies also highlights potential systemic considerations while signaling the attractiveness of domestic institutional participation.
This discourse format is designed to support clear, professional engagement. Additional data on exact valuation dates or refined macroeconomic parameters would permit further precision in the conversions and analysis.
Compare to global peers
Comparative Analysis: Nigerian Trillion-Naira Market Cap Companies versus Global Peers (as of April 2026)
Introduction
This discourse compares the market capitalizations of Nigerian companies that have crossed the ₦1 trillion threshold (as presented in the original data) with selected global and regional peers. All figures are expressed in current 2026 USD for consistency. Nigerian values have been converted using an approximate exchange rate of ₦1,360 per USD (prevailing mid-April 2026 rates ranged between ₦1,340–1,380).
Nigerian market caps reflect strong nominal growth in local currency terms, driven by domestic investor confidence, sector resilience, and market expansion. However, when benchmarked internationally, they remain modest due to currency depreciation, inflation differentials, and the smaller scale of the Nigerian economy relative to global leaders.
Key Context:
- Global top companies (primarily U.S.-based technology firms) dominate with market caps in the trillions of USD.
- African peers (particularly from South Africa and energy-heavy markets) provide a more relevant regional benchmark.
- Sector-specific comparisons highlight Nigeria’s strengths in consumer goods, telecommunications, cement, and banking, while underscoring gaps in technology, scale, and global reach.
Tabulated Comparison (Selected Nigerian Companies vs. Global and Regional Peers)
| Nigerian Company (Sector) |
Nigerian Market Cap (2026 USD Billion, approx.) |
Global / Regional Peer |
Peer Market Cap (2026 USD Billion) |
Comparison Insight |
| BUA Foods Plc (Consumer Goods/Food) |
~9.2 |
Nestlé (Switzerland, Global Food) |
~250–280 |
BUA Foods is approximately 3–4% the size of Nestlé; reflects strong local dominance but limited international scale. |
| MTN Nigeria Plc (Telecom) |
~7.3–12.7 (recent data shows higher nominal) |
Verizon (U.S., Telecom) |
~170–180 |
MTN Nigeria is roughly 4–7% of Verizon; larger than many African telecoms but far below global leaders like AT&T or Vodafone Group. |
| Dangote Cement Plc (Cement/Industrial) |
~6.6–10.1 |
CRH (Ireland, Global Cement leader) |
~79 |
Dangote is ~8–13% of CRH; dominant in Africa (top cement producer by capacity) yet modest globally. |
| Airtel Africa Plc (Telecom) |
~6.3 |
Bharti Airtel (India, Parent/Regional) |
~100+ |
Airtel Africa is a fraction of its parent; illustrates emerging market telecom valuations. |
| BUA Cement Plc (Cement) |
~4.0 |
HeidelbergCement (Germany) |
~39 |
Approximately 10% the size; underscores Nigeria’s cement oligopoly but smaller global footprint. |
| Zenith Bank Plc / GTCO Plc (Banking) |
~1.8–2.3 |
JPMorgan Chase (U.S., Global Banking) |
~650–700 |
Nigerian banks are <0.5% the size of global leaders; comparable to mid-tier emerging market banks. |
| Nigerian Breweries Plc (Breweries) |
~1.5 |
Anheuser-Busch InBev (Global) |
~120–140 |
Less than 2% the size; highlights local consumer staple strength versus multinational scale. |
Notes on Data:
- Nigerian figures derived from the provided list, adjusted to 2026 USD.
- Global peer data drawn from April 2026 market rankings (e.g., NVIDIA at ~$4.5–5.0 trillion leads globally, followed by Alphabet, Apple, and Microsoft in the $3–4 trillion range).
- Regional context: South African heavyweights (e.g., AngloGold Ashanti ~$55B) and Saudi Aramco (~$1.6–1.8T) dwarf most Nigerian entries. Nigeria’s entire listed market capitalization stood near $90–100B in early 2026, compared to the U.S. market exceeding $60 trillion.
Analytical Observations
Scale Disparity: The largest Nigerian company (BUA Foods or MTN Nigeria, depending on exact timing) equates to roughly $9–13 billion USD. In contrast, the world’s top five companies (NVIDIA, Alphabet, Apple, Microsoft, Amazon) each exceed $2.5 trillion, with NVIDIA surpassing $4.5–5.0 trillion. A single global technology leader is thus 200–500 times larger than Nigeria’s market leaders. This gap reflects differences in economic size, innovation ecosystems, and access to global capital.
Sectoral Context:
- Consumer Goods & Food: Nigerian firms like BUA Foods and Nestlé Nigeria demonstrate robust domestic performance amid population-driven demand. However, they operate at a fraction of multinational peers such as Nestlé or Unilever, which benefit from diversified global operations and brand portfolios.
- Telecommunications: MTN Nigeria and Airtel Africa rank among Africa’s largest telecom operators by subscribers and influence. Yet they remain significantly smaller than global incumbents (e.g., Verizon, AT&T) or even regional Asian leaders, partly due to currency effects and regulatory environments.
- Cement & Industrials: Dangote Cement stands as one of Africa’s largest cement producers by production capacity. Globally, it is competitive in emerging markets but trails leaders like CRH or Holcim in market capitalization and geographic diversification.
- Banking & Financial Services: Nigerian banks (Zenith, GTCO, UBA) exhibit solid local growth and profitability. Internationally, they align with other emerging-market institutions but are dwarfed by global systemically important banks.
Regional Perspective within Africa: Nigerian companies feature prominently among Africa’s most valuable listed firms, alongside South African mining and financial entities. South Africa’s market remains larger overall, while energy giants like Saudi Aramco (Middle East/Africa context) illustrate the premium placed on resource scale. Nigeria’s “SWOOT” cohort (Stocks Worth Over One Trillion Naira) signals capital market maturation and concentration, yet the aggregate Nigerian equity market remains a small fraction of continental or global totals.
Adjustments and Nuances:
- Currency and Inflation Effects: Nominal ₦ growth appears impressive, but USD conversions reveal erosion from Naira depreciation. PPP-adjusted views (as previously discussed) would elevate local economic significance.
- Growth Dynamics: Nigeria’s equity market delivered strong performance in early 2026 (ranking among top global performers in certain periods), driven by domestic reforms and investor inflows. Sustained real growth depends on inflation moderation, currency stability, and productivity enhancements.
- Valuation Considerations: Many Nigerian firms trade at attractive multiples relative to global peers in similar sectors (e.g., telecom EV/EBITDA), reflecting perceived macro risks but also offering potential upside for long-term investors.
Broader Implications
The achievement of multiple Nigerian companies surpassing ₦1 trillion in market capitalization marks a milestone in the development of Africa’s largest economy by population. It underscores domestic market depth, sectoral resilience, and appeal to institutional investors. Nevertheless, the comparison to global peers highlights structural realities: limited scale, exposure to local macroeconomic volatility, and the dominance of technology and platform businesses in worldwide value creation.
For investors and policymakers, these insights emphasize the need for continued reforms to enhance competitiveness, attract foreign capital, and support value-chain expansion beyond domestic boundaries. While Nigerian leaders excel within their operating environment, bridging the gap with global frontrunners will require innovation, governance improvements, and integration into broader international markets.
This comparative framework facilitates informed discourse on Nigeria’s capital market positioning. Further granularity on exact valuation dates, financial ratios (e.g., P/E, EV/EBITDA), or revenue metrics would enable deeper sector-specific benchmarking.