
ChatGPT o1 preview
What’s been the trend of Nigeria’s GDP from 2015 to 2024 in Naira and in US dollars?
Show it graphically.
Answer
Nigeria’s GDP Trend from 2015 to 2022
GDP in Naira:
Nigeria’s Gross Domestic Product (GDP) in Naira has shown a consistent nominal increase from 2015 to 2022. This upward trend reflects economic growth and inflation within the country.
- 2015: Approximately ₦95 trillion
- 2016: Approximately ₦102 trillion
- 2017: Approximately ₦114 trillion
- 2018: Approximately ₦127 trillion
- 2019: Approximately ₦145 trillion
- 2020: Approximately ₦152 trillion
- 2021: Approximately ₦173 trillion
- 2022: Approximately ₦200 trillion
GDP in US Dollars:
Measured in US dollars, Nigeria’s GDP trend shows fluctuations due to exchange rate variations and changes in global oil prices, which significantly impact the economy.
- 2015: Around $486 billion
- 2016: Around $404 billion
- 2017: Around $375 billion
- 2018: Around $397 billion
- 2019: Around $448 billion
- 2020: Around $432 billion
- 2021: Around $440 billion
- 2022: Around $504 billion
Trend Analysis:
- 2015-2016: The GDP in USD decreased due to an economic recession triggered by falling oil prices and production challenges.
- 2017: GDP in USD reached its lowest point during this period, reflecting ongoing economic difficulties.
- 2018-2019: Recovery phase with increasing GDP in USD as oil prices stabilized and economic reforms were implemented.
- 2020: A slight decline due to the COVID-19 pandemic’s impact on global oil demand and prices.
- 2021-2022: Growth resumed with improvements in economic activities and a rebound in oil prices.
Graphical Representation:
While I can’t display a graph here, imagine two lines representing GDP over time:
- GDP in Naira: A steadily rising line from 2015 to 2022, indicating continuous nominal growth due to inflation and economic expansion.
- GDP in US Dollars: A line that dips from 2015 to 2017, rises gradually until 2019, dips slightly in 2020, and then ascends in 2021 and 2022, reflecting the fluctuations caused by exchange rates and global oil prices.
Summary:
- In Naira Terms: Consistent nominal growth each year from 2015 to 2022.
- In US Dollar Terms: Fluctuating trend influenced by currency depreciation and global economic factors, with a significant dip around 2016-2017 and recovery in subsequent years.
Note: The figures for 2023 and 2024 are not available as they depend on future economic developments.
ChatGPT 4o
What has been Nigeria’s annual GDP growth rate for the following periods / presidencies.
2015 to 2019 Buhari
2019 to 2023 Buhari
2023 to 2024 Tinubu.
Compare and contrast the trend, adducing reasons.
Answer
Nigeria’s annual GDP growth rates during the presidencies of Muhammadu Buhari (2015–2023) and Bola Tinubu (2023–2024) are as follows:
Muhammadu Buhari’s Presidency (2015–2023):
- 2015: 2.65%
- 2016: -1.62%
- 2017: 0.81%
- 2018: 1.92%
- 2019: 2.21%
- 2020: -1.79%
- 2021: 3.65%
- 2022: 3.25%
- 2023: 2.86%
Bola Tinubu’s Presidency (2023–2024):
- 2024: 3.19% (as of Q2 2024)
Trend Analysis:
-
2015–2019 (First Term of Buhari): The period began with modest growth in 2015, followed by a recession in 2016 due to declining oil prices and production disruptions. Recovery was slow, with growth rates below 2% in 2017 and 2018, and a slight improvement to 2.21% in 2019.
-
2019–2023 (Second Term of Buhari): The economy faced another contraction in 2020, primarily due to the COVID-19 pandemic’s impact on global oil demand and domestic economic activities. Subsequent years saw a rebound, with growth rates exceeding 3% in 2021 and 2022, before slightly declining to 2.86% in 2023.
-
2023–2024 (Tinubu’s Presidency): Preliminary data for 2024 indicates a growth rate of 3.19% in the second quarter, suggesting a continuation of the recovery trend.
Factors Influencing GDP Growth:
-
Oil Sector Dependence: Nigeria’s economy is heavily reliant on oil exports. Fluctuations in global oil prices and production levels significantly impact GDP growth. The recessions in 2016 and 2020 were largely due to oil sector downturns.
-
Diversification Efforts: Both administrations have aimed to diversify the economy by promoting agriculture, manufacturing, and services. The services sector, in particular, has shown consistent growth, contributing significantly to GDP.
-
External Shocks: Global events, such as the COVID-19 pandemic, have adversely affected economic performance. The pandemic led to reduced oil demand and disrupted economic activities, resulting in the 2020 recession.
-
Policy Measures: Economic policies, including fiscal stimulus, monetary interventions, and structural reforms, have influenced growth trajectories. Efforts to improve infrastructure, enhance the business environment, and attract foreign investment have been pivotal.
Conclusion:
Nigeria’s GDP growth has experienced fluctuations over the past decade, influenced by external shocks, oil sector dynamics, and policy responses. While recent data indicates a positive growth trend, sustained efforts in economic diversification and structural reforms are essential for long-term stability and resilience.
Revisited in 2026.
From 1999 till now, plot the fluctuations in Nigeria’s GDP per capita in purchasing power parity, but in nominal Naira or dollar. Explain what historically accounts for each major change. Identify the periods by the ruling president. Objectively, which government has done best? Worst? Why and how?
ChatGPT
1. NIGERIA'S GDP PER CAPITA, 1999–2026
A Historical Assessment of Economic Performance Under Five Presidents, Using Purchasing Power Parity (PPP)
1.1. Executive Summary
The evidence reveals three distinct chapters in Nigeria's economic history since the return to democracy.
1. 1999–2015: Broadly Sustained Economic Expansion. GDP per person rose substantially, supported by economic reforms, telecommunications, expanding services and favourable oil prices.
2. 2015–2023: A Prolonged Reversal. Nigeria's economy grew too slowly to keep pace with its population, and real GDP per person declined.
3. 2023–2026: A Modest Recovery Under Difficult Living Conditions. Economic growth has improved, but high prices and widespread poverty continue to constrain household welfare.
1.2. Understanding the Two Measures of GDP Per Capita
There is an important distinction between GDP per capita in current purchasing-power-adjusted dollars and GDP per capita in constant purchasing-power-adjusted dollars.
The former tells us the value of output per person at each year's prevailing prices. The latter removes price changes, making it much better for judging whether Nigerians became economically better off over time.
1.2.1. Nigeria's GDP Per Capita in 2025
| Economic Indicator | 2025 Value |
|---|---|
| GDP per capita, current PPP | Int$9,532 |
| GDP per capita, real PPP | Int$8,145 |
The current PPP figure is expressed at current international-dollar prices, while the real PPP figure is expressed at constant 2021 international-dollar prices.
Both figures come from World Bank data updated in October 2026. The latest complete annual observation is 2025; 2026 is assessed separately using available economic indicators.
1.3. The Central Finding
Nigeria's real GDP per person in 2025 was still below its 2015 peak, notwithstanding the considerable increase in nominal GDP and nominal Naira values.
2. THE HISTORICAL GRAPHS: 1999–2025
2.1. Graph A — Nominal GDP Per Capita, Adjusted for PPP
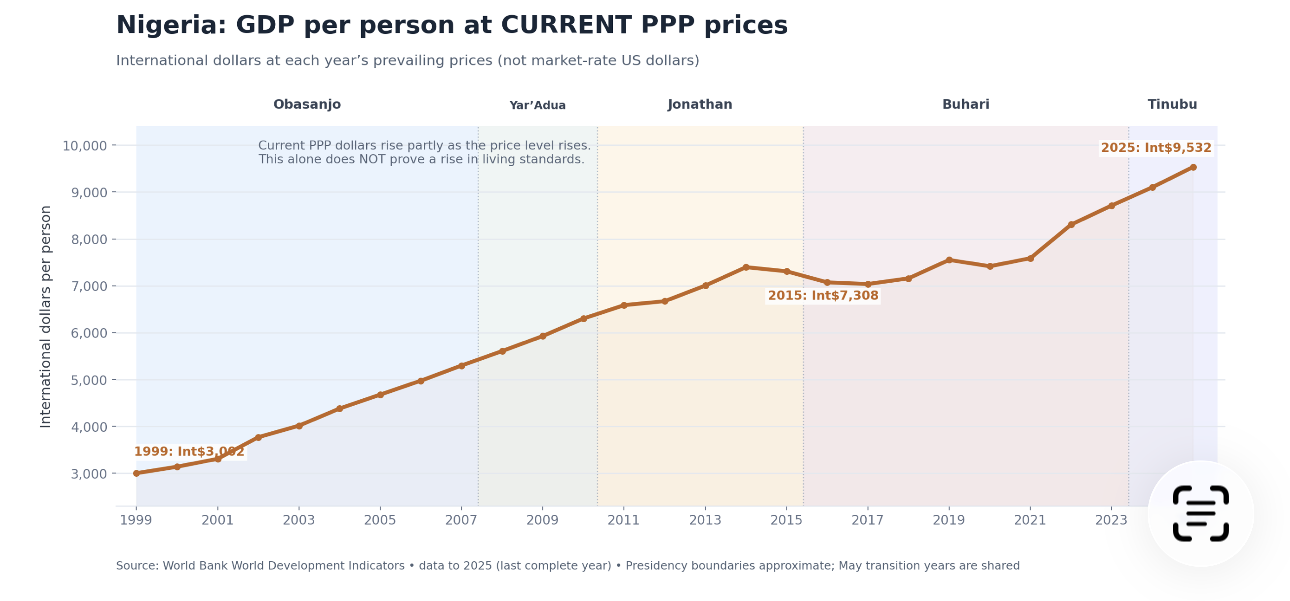
This graph answers the request for GDP per capita expressed at current prices, using purchasing power parity rather than ordinary market exchange rates.
[INSERT GRAPH A HERE: Nigeria GDP per Capita at Current PPP Prices, 1999–2025, With Presidential Periods.]
The apparent increase from Int$3,002 in 1999 to Int$9,532 in 2025 is approximately 218%.
However, much of the difference reflects changing prices rather than increased production per person.
2.2. Graph B — Real GDP Per Capita, Adjusted for PPP

This is the more revealing graph for evaluating presidential performance.
[INSERT GRAPH B HERE: Nigeria Real GDP per Capita Adjusted for PPP, 1999–2025, With Presidential Periods.]
The graph reveals an uninterrupted long-term upward trend until about 2014–2015, followed by a lengthy decline and then a partial recovery.
The real figure rose approximately 70% between 1999 and 2025, far less than the 218% suggested by the current-price calculation.
More importantly, Nigerians' average real economic output per person was approximately 8.4% lower in 2025 than at the 2015 peak.
2.2.1. Data Sources
World Bank, World Development Indicators:
Current PPP: NY.GDP.PCAP.PP.CD
Constant PPP: NY.GDP.PCAP.PP.KD
3. COMPARING THE FIVE PRESIDENCIES
3.1. Presidential Performance Using Real PPP GDP Per Capita
The following table uses real PPP GDP per capita and measures the change between approximate presidential transition years.
All amounts are in constant 2021 international dollars, rounded to the nearest dollar.
| President | Comparison Period | GDP Per Capita: Start to End | Total Change | Annualised Change |
|---|---|---|---|---|
| Olusegun Obasanjo | 1999–2007 | 4,782 → 6,949 | +45.3% | +4.78% |
| Umaru Musa Yar'Adua | 2007–2010 | 6,949 → 7,963 | +14.6% | +4.64% |
| Goodluck Jonathan | 2010–2015 | 7,963 → 8,892 | +11.7% | +2.23% |
| Muhammadu Buhari | 2015–2023 | 8,892 → 7,844 | −11.8% | −1.56% |
| Bola Ahmed Tinubu | 2023–2025 | 7,844 → 8,145 | +3.8% | +1.90% |
Note: Annualised change is the compound yearly growth rate. Transition years are shared between administrations, so these are indicative presidential comparisons, not exact causal estimates.
3.2. Ranking by Average Annualised Growth
| Rank | President | Average Annual Growth in Real GDP Per Capita |
|---|---|---|
| 1 | Obasanjo | +4.78% |
| 2 | Yar'Adua | +4.64% |
| 3 | Jonathan | +2.23% |
| 4 | Tinubu | +1.90% |
| 5 | Buhari | −1.56% |
3.3. Interpreting the Presidential Rankings
The ranking by sustained improvement in real economic output per person is therefore Obasanjo, Yar'Adua, Jonathan, Tinubu and Buhari, based strictly on these periods and this indicator.
However, these percentages do not by themselves tell us how much credit or blame belongs to each president.
Government policy, oil prices, inherited institutions, population growth, global events and implementation delays must all be considered.
4. HISTORICAL EXPLANATIONS OF THE MAJOR ECONOMIC CHANGES
4.1. Obasanjo Administration: 1999–2007
Economic Outcome: Strong Expansion.
Change in Real GDP Per Capita: +45.3%.
4.1.1. The Economy Inherited in 1999
The administration inherited an economy weakened by years of military rule, inadequate infrastructure, limited investment and weak economic institutions.
Nigeria subsequently experienced one of its strongest sustained periods of economic expansion.
4.1.2. Economic Liberalisation and Institutional Reforms
The most consequential developments were economic liberalisation and institutional reforms.
Telecommunications liberalisation beginning in 2001 created opportunities for new investment, employment and business activity.
Banking consolidation, fiscal reforms, the Excess Crude Account, debt relief and improved public financial management helped change the economy's investment environment.
4.1.3. The Contribution of Rising Oil Prices
Oil prices also increased considerably during this period, providing more government revenue and foreign exchange.
The sharp rise around 2002–2004 reflects a period of rapid recorded expansion, including strong non-oil activity and the recovery of oil production in 2003.
The historical series has been revised, so no single year's increase should automatically be credited to a particular reform.
4.1.4. International Assessment
The World Bank's 2022 review explicitly identifies the 2001–2008 reform period as a turning point in Nigeria's economic performance.
4.1.5. Overall Assessment of Obasanjo
Obasanjo combined favourable external conditions with significant domestic structural reforms.
This gives his government the strongest claim to sustained economic improvement, although shortcomings in electricity, industrialisation and poverty reduction persisted.
4.2. Yar'Adua Administration: 2007–2010
Economic Outcome: Continued Expansion.
Change in Real GDP Per Capita: +14.6%.
4.2.1. The Economy Inherited in 2007
Yar'Adua inherited an expanding economy with stronger reserves, lower external debt and the benefits of reforms undertaken by his predecessor.
4.2.2. The Global Financial Crisis of 2008
His government faced the 2008 global financial crisis and the accompanying instability in Nigeria's banking sector.
The Central Bank intervened to stabilise troubled banks.
4.2.3. Niger Delta Amnesty and Oil Production
The 2009 Presidential Amnesty Programme addressed Niger Delta militancy and helped facilitate a recovery in oil production.
4.2.4. Economic Resilience During Global Financial Instability
Despite the global crisis, Nigeria's real GDP per capita continued to increase.
The IMF credited earlier reforms, Nigeria's relatively strong financial position and crisis interventions with helping the country withstand external shocks.
4.2.5. Overall Assessment of Yar'Adua
The administration recorded a strong economic outcome during a difficult global period.
However, the presidency lasted only about three years, and the 2010 comparison year includes much of Jonathan's presidency.
Consequently, Yar'Adua's annualised growth should not be treated as entirely his government's achievement.
4.3. Jonathan Administration: 2010–2015
Economic Outcome: Growth Followed by a Slowdown.
Change in Real GDP Per Capita: +11.7%.
4.3.1. Continued Economic Expansion
Nigeria continued expanding, supported by relatively high oil prices, telecommunications, trade, agriculture, financial services and other non-oil activities.
The IMF estimated that overall GDP growth averaged approximately 6.8% annually over the preceding decade in its 2015 assessment.
4.3.2. Structural Weaknesses Despite Growth
Real GDP per capita was increasing more slowly than under the preceding administrations.
Insecurity, inadequate electricity, infrastructure problems, oil theft, poverty and insufficient productivity growth continued to restrict economic development.
4.3.3. The Collapse of Oil Prices in 2014
The decisive external change was the collapse in global oil prices beginning in the second half of 2014.
This weakened fiscal revenue, foreign exchange availability and economic confidence before Buhari assumed office in May 2015.
4.3.4. The 2014 GDP Rebasing
Nigeria's famous GDP rebasing in 2014 dramatically increased its reported economic size.
That statistical revision did not mean Nigeria had suddenly created an equivalent quantity of new goods or wealth.
4.3.5. Overall Assessment of Jonathan
The administration presided over the final years of Nigeria's long expansion, but insufficient progress was made in reducing economic vulnerability to oil revenue shocks.
4.4. Buhari Administration: 2015–2023
Economic Outcome: Prolonged Decline.
Change in Real GDP Per Capita: −11.8%.
This was the most damaging presidential period in the comparison when measured by real GDP per capita.
4.4.1. First Phase: 2015–2017 — Oil Shock and Recession
Buhari inherited falling oil prices and an economy already slowing.
Subsequent oil-production disruptions, foreign exchange shortages and investment uncertainty contributed to recession in 2016.
Real GDP per capita fell approximately 4.0% in that year alone.
4.4.2. Second Phase: 2017–2019 — Economic Stagnation
Nigeria resumed modest aggregate GDP growth, but population growth absorbed nearly all the gains.
Output per person remained broadly stagnant or declined slightly.
4.4.3. Third Phase: 2020–2021 — Pandemic and Deeper Economic Losses
COVID-19, lockdowns and another oil-market shock aggravated existing weaknesses.
In the latest World Bank PPP series, real GDP per capita fell approximately 8.3% in 2020, followed by another modest decline in 2021.
4.4.4. Fourth Phase: 2022–2023 — Partial Recovery
Economic activity improved, but insufficiently to restore the income per person lost since 2015.
4.4.5. External Shocks Versus Domestic Policy Decisions
Some causes were beyond the government's control: the global oil collapse, COVID-19 and international economic disruptions.
Other problems were affected by domestic policy, including:
- Administrative foreign exchange rationing.
- Multiple exchange rates.
- Trade restrictions.
- Substantial central-bank financing of fiscal deficits.
- Inadequate responses to insecurity and oil theft.
The World Bank and IMF criticised several of these policies for discouraging investment, worsening inflation, increasing costs and restricting the business environment.
4.4.6. Overall Assessment of Buhari
It would be incorrect to attribute every economic setback to Buhari.
However, the government had eight years to strengthen the economy's capacity to respond to shocks.
The prolonged decline in output per person, combined with policy weaknesses, makes this the worst performance in the five-government comparison.
4.5. Tinubu Administration: May 2023–November 2026
Economic Outcome: Modest Real Recovery.
Change in Real GDP Per Capita, 2023–2025: +3.8%.
4.5.1. The Economy Inherited in 2023
Tinubu inherited an economy with serious foreign exchange distortions, fuel subsidy liabilities, inflation, weak public finances and deteriorating household purchasing power.
4.5.2. Petrol Subsidy Removal and Foreign Exchange Reforms
His administration introduced two fundamental reforms:
- Removing the petrol subsidy.
- Changing the foreign exchange system towards market-determined pricing.
These addressed important fiscal and foreign exchange imbalances.
4.5.3. Immediate Economic Hardship
However, the reforms also produced immediate increases in transport, fuel, imported-input and food costs, imposing substantial hardship on households.
4.5.4. Real GDP Per Capita Recovery by 2025
By 2025, the World Bank's real PPP GDP per capita had recovered to Int$8,145, approximately 3.8% above 2023.
This is a meaningful improvement, but not sufficient to return Nigeria to its 2015 peak.
4.5.5. Economic Developments in 2026
There is also evidence of improvement extending into 2026.
| Economic Indicator | Reported Development |
|---|---|
| Real GDP Growth, First Half of 2026 | 4.2% year on year |
| Real Gross Federation Revenue, 2023–2025 | +69% |
The World Bank reported stronger economic activity, improved public revenues and more stable foreign exchange conditions in October 2026.
Nevertheless, inflation remained burdensome, and the IMF estimated that 63% of Nigerians were below the national poverty line in 2025.
4.5.6. Overall Assessment of Tinubu
Tinubu has made significant attempts to correct long-standing economic distortions.
These may strengthen longer-term growth, but their success must ultimately be measured by sustained productivity, investment, real wages, employment and poverty reduction — not reforms or fiscal revenue improvements alone.
It is premature to give a definitive historical ranking to an administration still in office.
5. IMPORTANT STATISTICAL CAUTIONS
5.1. GDP Rebasing Does Not Automatically Make People Richer
Nigeria rebased GDP in 2014 and again in 2025.
The 2025 exercise used 2019 as the new base year and increased the estimated nominal size of the 2019 economy by approximately 41.7% on the National Bureau of Statistics' stated comparison basis.
These revisions improve measurement by capturing previously undercounted activities.
They do not represent an immediate 41.7% increase in goods and services produced.
5.2. GDP Per Capita Does Not Equal Household Income
The underlying relationship is:
GDP Per Capita = Total GDP ÷ Population
Suppose total real GDP increases by 4%, while population increases by 2.5%.
The approximate improvement in real GDP per person is only 1.5%.
Even that does not guarantee that the average household is better off.
GDP may grow mainly in oil, finance or other sectors without generating enough jobs or raising most people's wages.
5.3. PPP International Dollars Versus Market Exchange Rate Dollars
PPP-adjusted international dollars are not actual US-dollar earnings or ordinary Naira values.
For comparison, the World Bank's 2025 figure for nominal GDP per capita converted at market exchange rates was only about US$1,224, compared with Int$9,532 using current PPP.
They measure different things.
5.4. The Implications for Living Standards
A country can have increasing GDP per capita while large parts of its population face worsening living conditions.
This distinction is essential when assessing the success or failure of economic policies.
6. OBJECTIVE VERDICT: WHICH GOVERNMENT PERFORMED BEST OR WORST?
6.1. Presidential Performance by Selected Economic Criteria
| Evaluation Criterion | Strongest or Weakest Result | Assessment |
|---|---|---|
| Best Sustained Real GDP Per Capita Growth | Obasanjo | Largest sustained rise and highest annualised rate across a substantial tenure. |
| Strong Short-Term Growth Amid Global Shocks | Yar'Adua | Growth remained strong despite the global financial crisis; attribution is shared. |
| Highest Real GDP Per Capita | 2014–2015 Transition | Reached approximately Int$8,892 at the end of the Jonathan-era expansion. |
| Worst Sustained GDP Per Capita Performance | Buhari | Substantial cumulative decline over eight years. |
| Most Consequential Recent Adjustment of Major Economic Distortions | Tinubu | Important reforms, but long-term welfare results are not yet established. |
6.2. Best-Performing Government: Obasanjo
Obasanjo was the best-performing president on the economic measure used here.
His administration sustained the strongest combination of growth per person, economic liberalisation and institutional reform.
Favourable oil prices helped, but the record cannot be explained by oil alone.
6.3. Worst-Performing Government: Buhari
Buhari was the worst-performing president on the same measure.
His administration inherited an oil shock and suffered a pandemic, but domestic policy decisions also contributed to an extended period of weak growth, uncertainty and declining real output per person.
6.4. Other Presidential Assessments
6.4.1. Yar'Adua
Yar'Adua deserves recognition for preserving growth through a global financial crisis, although his short tenure limits the comparison.
6.4.2. Jonathan
Jonathan maintained substantial growth, but the economy remained vulnerable to external shocks.
6.4.3. Tinubu
Tinubu has begun an economically important adjustment, but the benefits have yet to become sufficiently broad-based to justify declaring his administration a major success.
6.5. Limitations of the Presidential Ranking
This is an evidence-based ranking of real GDP per capita performance, not a complete ranking of national development or presidential competence.
A fuller verdict would also compare:
- Poverty reduction.
- Real household consumption.
- Employment generation.
- Education outcomes.
- Health outcomes.
- Infrastructure development.
- Insecurity and public safety.
- Public debt and fiscal sustainability.
- Quality of economic institutions.
These indicators are necessary to establish whether economic expansion translated into genuine improvements in people's lives.
7. CONCLUSION: THE FUNDAMENTAL CHALLENGE OF NIGERIAN ECONOMIC DEVELOPMENT
7.1. The Central Economic Problem
Nigeria's fundamental economic difficulty is not simply the failure to generate GDP growth.
It is the repeated failure to produce enough sustained, inclusive productivity growth to substantially outpace population growth and improve household welfare.
7.2. Lessons From the Three Economic Periods
1999–2015: The period demonstrates that sustained economic expansion is possible.
2015–2023: The period demonstrates how quickly economic gains can be reversed.
2023–2026: The recovery suggests that economic progress can resume, but real GDP per capita remains below the previous peak.
7.3. The Ultimate Test of Government Performance
For national development, the critical test of any government should ultimately be this:
Are Nigerians producing more value per person, earning greater real incomes, and escaping poverty in increasing numbers?
That is a more meaningful standard than the nominal size of the economy, the value of the Naira, or growth percentages considered in isolation.
8. SOURCES AND REFERENCES
8.1. World Bank: GDP Per Capita, PPP, Constant International Dollars
World Bank — Real GDP Per Capita, PPP, Nigeria
This series is the principal source for evaluating real changes in Nigeria's economic output per person over time.
8.2. World Bank: GDP Per Capita, PPP, Current International Dollars
World Bank — Current PPP GDP Per Capita, Nigeria
This series provides GDP per capita measured using current purchasing-power-adjusted international dollars.
8.3. World Bank: Nigeria Development Updates
World Bank — Nigeria Development Updates
These reports examine macroeconomic performance, structural reforms, fiscal policy, exchange rates, inflation and economic development challenges.
8.4. International Monetary Fund: Nigeria Country Reports
These reports provide assessments of Nigeria's macroeconomic conditions, government policies, external shocks, monetary policy, public finances and economic reform programmes.
8.5. National Bureau of Statistics
National Bureau of Statistics — Nigeria
The NBS is the principal national source for GDP statistics, GDP rebasing exercises, inflation, sectoral economic activity and other official economic indicators.
8.6. Important Note on Data Interpretation
The presidential comparisons in this report use annual data and approximate transition years.
The resulting rankings describe economic outcomes during each period and should not be interpreted as proof that every change was caused by the president in office.
For an assessment of government policy, these statistics should be interpreted alongside external shocks, inherited economic conditions, structural reforms, investment, productivity, population growth, and the distribution of economic gains.
Claude
Nigeria's GDP per Capita, 1999–2026: What Changed, Why, and Which President Did Best
Measured by real income per person (World Bank GDP per capita, PPP, constant 2021 international $), Olusegun Obasanjo's government did best (+45% over 1999–2007) and Muhammadu Buhari's did worst (−12% over 2015–2023). In 2025 the average Nigerian's real output was about where it stood in 2011, and still roughly 8% below the 2015 peak.
1. Summary
- Best: Obasanjo. Real GDP per capita (PPP) rose from $4,782 to $6,949, about 4.8% a year. Rising oil prices helped a lot, but so did his own policies: debt relief, telecom liberalisation, and banking and fiscal reforms. Yar'Adua grew at a similar pace (~4.6%/yr) over a short, partly inherited tenure. Jonathan's 2.2%/yr was weak given that oil averaged about $102 during his term.
- Worst: Buhari. Real GDP per capita fell from $8,892 to $7,843 (−1.6%/yr), with two recessions (2016 and 2020). The oil crash and COVID explain much of this. But per-capita income also fell in 2017–2019, when Brent was $54–71, and that points to policy: FX controls and multiple exchange rates, import compression, and deficit financing by the central bank.
- Tinubu (term ongoing): mixed and provisional. Real per-capita growth has returned (~+1.9%/yr in 2024–25). But nominal dollar income per head fell 43% (from $2,139 in 2023 to $1,224 in 2025) after the 2023 naira float. Headline inflation peaked at 34.8% in December 2024 (NBS CPI). The World Bank's April 2026 Nigeria Development Update puts poverty at 63% in 2025, about 140 million people. The PPP measure is improving; household living standards have not yet caught up.
2. Key Findings
- The three measures tell different stories. PPP per capita (current international $) more than tripled, from $3,002 (1999) to $9,532 (2025). Nominal US$ per capita is now about where it was in 2005, at $1,224, after peaking at $3,190 in 2019. Naira per capita rose about 42-fold (₦44,555 to ₦1,858,879), mostly because of inflation.
- Population growth eats most of Nigeria's growth. Population roughly doubled, from about 123 million (1999) to about 238 million (2025). Real GDP growth of 3–4% a year therefore turns into only about 1–2% per person.
- Exchange rates, not output, drive the dollar series. The official rate went from ₦92/$ (1999) to ₦193 (2015), ₦306 (2017), ₦645 (2023) and ₦1,518 (2025). The big dollar drops in 2016–17 and 2023–24 are mainly devaluations.
- Statistical breaks matter. The 2014 rebasing raised GDP 89%. The NBS's July 2025 rebasing raised nominal 2019 GDP by 41.7%, to ₦205.09 trillion. In the World Bank's nominal series, that second rebasing shows up as a jump in 2019, which flatters nominal comparisons after 2019.
- External conditions differed sharply by term (average Brent): Obasanjo ~$42 (2000–07), Yar'Adua ~$77 (2007–09), Jonathan ~$102 (2010–14), Buhari ~$62 (2015–22), Tinubu ~$77 (2023–25).
3. The Data: Three Series Side by Side
3.1 Which series to read for what
- PPP, constant 2021 int'l $ is the best measure of real living standards over time, and is the basis for ranking the presidents.
- PPP, current int'l $ includes global price inflation, so it rises almost every year.
- Current US$ shows international purchasing power and debt-servicing capacity, and swings with the exchange rate.
- Current naira is the number Nigerians see on payslips, inflated by domestic prices.
Sources: World Bank WDI (updated 11 November 2026); 2026 from IMF WEO October 2026. Real per-capita growth is the World Bank's GDP per capita growth series.
3.2 Annual figures, 1999–2026
| Year | President | PPP current int'l $ | PPP const. 2021 int'l $ | Current US$ | Current ₦ | ₦ per US$ | Real per-capita growth |
|---|---|---|---|---|---|---|---|
| 1999 | Obasanjo (from 29 May) | 3,002 | 4,782 | 481 | 44,555 | 92 | −2.0% |
| 2000 | Obasanjo | 3,139 | 4,889 | 547 | 55,884 | 102 | +2.2% |
| 2001 | Obasanjo | 3,309 | 5,040 | 566 | 63,409 | 111 | +3.1% |
| 2002 | Obasanjo | 3,770 | 5,655 | 712 | 86,171 | 121 | +12.2% |
| 2003 | Obasanjo | 4,015 | 5,905 | 763 | 98,810 | 129 | +4.4% |
| 2004 | Obasanjo | 4,381 | 6,275 | 962 | 128,487 | 133 | +6.3% |
| 2005 | Obasanjo | 4,678 | 6,497 | 1,211 | 159,442 | 131 | +3.5% |
| 2006 | Obasanjo | 4,975 | 6,703 | 1,600 | 203,755 | 129 | +3.2% |
| 2007 | Obasanjo → Yar'Adua (29 May) | 5,298 | 6,949 | 1,816 | 226,245 | 126 | +3.7% |
| 2008 | Yar'Adua | 5,607 | 7,216 | 2,154 | 253,525 | 119 | +3.8% |
| 2009 | Yar'Adua | 5,927 | 7,581 | 1,820 | 268,199 | 149 | +5.1% |
| 2010 | Jonathan (acting 9 Feb; president 6 May) | 6,301 | 7,963 | 2,202 | 327,720 | 150 | +5.0% |
| 2011 | Jonathan | 6,585 | 8,154 | 2,418 | 368,391 | 154 | +2.4% |
| 2012 | Jonathan | 6,671 | 8,266 | 2,633 | 410,620 | 158 | +1.4% |
| 2013 | Jonathan | 7,004 | 8,581 | 2,873 | 447,447 | 157 | +3.8% |
| 2014 | Jonathan | 7,396 | 8,885 | 3,089 | 484,876 | 159 | +3.5% |
| 2015 | Jonathan → Buhari (29 May) | 7,308 | 8,892 | 2,586 | 499,170 | 192 | +0.1% |
| 2016 | Buhari | 7,072 | 8,535 | 2,070 | 524,834 | 253 | −4.0% |
| 2017 | Buhari | 7,037 | 8,397 | 1,876 | 573,766 | 306 | −1.6% |
| 2018 | Buhari | 7,158 | 8,363 | 2,058 | 629,880 | 306 | −0.4% |
| 2019 | Buhari | 7,551 | 8,362 | 3,190 † | 979,019 † | 307 | 0.0% |
| 2020 | Buhari | 7,415 | 7,664 | 2,797 | 998,319 | 359 | −8.3% |
| 2021 | Buhari | 7,588 | 7,588 | 2,787 | 1,113,364 | 401 | −1.0% |
| 2022 | Buhari | 8,304 | 7,752 | 2,899 | 1,228,916 | 426 | +2.2% |
| 2023 | Buhari → Tinubu (29 May) | 8,712 | 7,843 | 2,139 | 1,378,004 | 645 | +1.2% |
| 2024 | Tinubu | 9,100 | 7,994 | 1,084 | 1,602,302 | 1,479 | +1.9% |
| 2025 | Tinubu | 9,532 | 8,145 | 1,224 | 1,858,879 | 1,518 | +1.9% |
| 2026 (IMF proj.) | Tinubu | ~10,051 | — | ~1,594 | — | — | ~+2.05% |
† 2019 statistical break. The World Bank's nominal series uses the 2025 rebased (2019 base-year) GDP from 2019 onward, while earlier years stay on the 2010 base. So 2018→2019 shows +55% in naira terms even though the exchange rate was flat, inflation was about 11%, and real growth was about 2%. The PPP series are linked and do not show this break.
4. Charts (Presidential Terms Marked)
4.1 Real GDP per capita, PPP (constant 2021 int'l $)
Each █ = 200 int'l $ above a 4,500 baseline. The axis is truncated to make the changes visible.
OBASANJO (1999–2007)
1999 █                      4,782
2000 ██                     4,889
2001 ███                    5,040
2002 ██████                 5,655
2003 ███████                5,905
2004 █████████              6,275
2005 ██████████             6,497
2006 ███████████            6,703
2007 ████████████           6,949
YAR'ADUA (2007–2010)
2008 ██████████████         7,216
2009 ███████████████        7,581
JONATHAN (2010–2015)
2010 █████████████████      7,963
2011 ██████████████████     8,154
2012 ███████████████████    8,266
2013 ████████████████████   8,581
2014 ██████████████████████ 8,885
2015 ██████████████████████ 8,892  ← peak
BUHARI (2015–2023)
2016 ████████████████████   8,535  recession
2017 ███████████████████    8,397
2018 ███████████████████    8,363
2019 ███████████████████    8,362
2020 ████████████████       7,664  COVID recession
2021 ███████████████        7,588  trough
2022 ████████████████       7,752
TINUBU (2023– )
2023 █████████████████      7,843
2024 █████████████████      7,994
2025 ██████████████████     8,145  ≈ 2011 level
4.2 Nominal GDP per capita, current US$
Each █ = $150.
OBASANJO
1999 ███                    481
2001 ████                   566
2003 █████                  763
2005 ████████             1,211
2007 ████████████         1,816
YAR'ADUA
2008 ██████████████       2,154
2009 ████████████         1,820  oil crash
JONATHAN
2010 ███████████████      2,202
2012 ██████████████████   2,633
2014 █████████████████████ 3,089  rebased peak
BUHARI
2015 █████████████████    2,586
2016 ██████████████       2,070  float
2017 █████████████        1,876
2018 ██████████████       2,058
2019 █████████████████████ 3,190 † break
2020 ███████████████████  2,797
2022 ███████████████████  2,899
TINUBU
2023 ██████████████       2,139  FX unified
2024 ███████              1,084
2025 ████████             1,224
2026f ███████████         1,594  (IMF)
4.3 Naira per capita (summary)
It rises almost every year: ₦44,555 (1999), ₦226,245 (2007), ₦499,170 (2015), ₦1.38m (2023), ₦1.86m (2025). This is mostly inflation, which averaged about 14% a year over the last 20 years. In real naira terms the path matches Chart 4.1.
5. Why the Three Series Diverge
- Devaluations. The naira was held near ₦197–199/$ from March 2015, floated in June 2016, and then managed under multiple FX windows. On 14 June 2023 the central bank unified the FX market, and the naira immediately fell 36% on the official market. In 2024 the annual average rate more than doubled, from ₦645 to ₦1,479. Each devaluation cut dollar GDP per head overnight, even though output barely changed.
- Rebasing. In April 2014 Nigeria moved its GDP base year from 1990 to 2010. Estimated GDP rose 89%, to about $510 billion, and Nigeria overtook South Africa as Africa's largest economy. On 21 July 2025 the NBS moved the base year to 2019: nominal 2019 GDP rose 41.7%, and 2024 GDP was put at ₦372.8 trillion (about $243 billion). Rebasing changes the level of GDP, not real living standards.
- Inflation. Naira GDP per head rises with domestic prices. PPP and constant-price series strip this out.
- PPP revisions. The World Bank's ICP 2021 results (May 2024) re-anchored all PPP series to 2021 prices, so older published PPP figures do not match today's.
- Source discrepancies.
- The World Bank's 2024 PPP figure moved from $9,087 in earlier vintages to $9,100 in the November 2026 update.
- Older IMF vintages from before the 2025 rebasing put 2024 nominal GDP per capita near $877 and PPP near $6,543.
- The IMF's October 2026 WEO puts 2025 at $1,223, against the World Bank's $1,224.
- Use one source and one vintage for any comparison.
6. What Drove Each Major Change, by President
6.1 Olusegun Obasanjo (29 May 1999 – 29 May 2007): strong, oil-assisted, reform-backed rise
- Starting point. He inherited an economy coming out of military rule. Real per-capita income fell 2% in 1999, and dollar GDP per head collapsed from $1,822 (1998) to $481 (1999) as the exchange rate moved to about ₦92/$ from an artificially strong official rate.
- Oil tailwind. Brent rose from $28.66 (2000) to $72.44 (2007). Crude output peaked at about 2.47 million bpd in 2005.
- Telecoms. The GSM licence auction in January 2001 brought in MTN and Econet, which launched commercially in August 2001. In 1999 Nigeria had about 400,000 phone lines for 120 million people; by 2008 subscribers numbered roughly 44–60 million, depending on the source. This was a durable, policy-made productivity gain.
- Debt relief. In October 2005 the Paris Club agreed to cancel $18 billion of Nigeria's roughly $30.4 billion Paris Club debt (about 60%) in exchange for Nigeria paying about $12.4 billion. The deal closed on 21 April 2006. General government debt fell from 46% of GDP (1999) to about 6% (2007), according to IMF data.
- Banking and fiscal reform. Banks were consolidated in 2004–05, and oil revenues were managed more prudently.
- Data caveat. The +12.2% per-capita jump in 2002 comes from back-cast, spliced data after the 2014 rebasing and should be treated as approximate.
6.2 Umaru Musa Yar'Adua (29 May 2007 – 5 May 2010; incapacitated from November 2009): solid growth through a global crisis
- Growth. Real per-capita income grew 3.8% (2008) and 5.1% (2009), even as Brent crashed from $96.94 (2008) to $61.74 (2009). In dollar terms GDP per head fell 15% in 2009, because the naira weakened from ₦119 to ₦149.
- Banking crisis. The 2008–09 crisis followed a margin-lending and stock-market bust. In 2009 the central bank, under Sanusi, injected ₦620 billion into troubled banks and replaced their managements. AMCON, created by an Act signed on 19 July 2010, then absorbed bad loans.
- Niger Delta amnesty (2009). Helped restore oil output to about 2.4 million bpd by 2010–11.
- Caveat. A short tenure riding Obasanjo-era momentum; much of 2010 was governed by Jonathan.
6.3 Goodluck Jonathan (Acting President 9 February 2010; President 6 May 2010 – 29 May 2015): peak levels, slowing growth despite record oil prices
- Peak. GDP per capita peaked at $3,089 in nominal terms (2014) and $8,892 in real PPP terms (2015). After the 2014 rebasing, Nigeria was Africa's largest economy.
- Slowing growth. Real per-capita growth slowed to 1.4–3.8% a year, even though Brent averaged about $102 in 2011–14, the best oil prices of any term. Large windfalls did not become faster per-capita growth or bigger buffers.
- Oil-price collapse. When Brent fell 46% in 2015, the economy had little protection. Growth per head was +0.1% in 2015, and the naira began sliding.
- Insecurity. Boko Haram's insurgency escalated, including the Chibok abductions of April 2014, and weighed on the north-east.
6.4 Muhammadu Buhari (29 May 2015 – 29 May 2023): two recessions and a lost decade per head
- 2016 recession (−4.0% per capita).
- External causes: Brent averaged $43.64, and militant attacks cut output to about 1.87 million bpd.
- Policy made it worse. The administration defended a ₦197–199/$ peg while the parallel rate reached about ₦370, rationed FX, and resisted devaluation until the June 2016 float. That float produced a multiple-rate system, and the parallel premium persisted.
- 2017–2019 stagnation (−1.6%, −0.4%, 0.0%). Oil recovered to $54–71, yet per-capita income still fell. This is the strongest evidence that domestic policy and structure, not just oil, held growth below population growth.
- 2020 COVID recession (−8.3% per capita). Brent fell to $41.96. On the rebased NBS series, real GDP fell 6.96%, a much deeper recession than the old series showed.
- 2021–2022.
- Oil theft cut output to about 1.29 million bpd in 2022, and briefly below 1 million in August 2022, so Nigeria could not fully benefit from $100 oil.
- The World Bank put the 2022 cost of the implicit FX subsidy at ₦6.2 trillion (more than 3% of GDP) and the petrol subsidy at ₦4.5 trillion (about 2% of GDP), roughly ₦10 trillion a year combined.
- The central bank financed deficits through "Ways and Means" advances, which reached ₦22.72 trillion by 19 December 2022 (Senate ad hoc committee figure). The National Assembly approved securitising them in May 2023 (40-year tenor, 9% interest); the House's figure of about ₦23.7 trillion includes a further ₦1 trillion.
- 2023 cash crunch. The late-2022/early-2023 naira redesign caused a cash shortage, and real GDP growth slowed to 2.31% in Q1 2023, which the NBS attributed to the cash crunch. The World Bank concluded that the previous policy mix had not delivered the hoped-for growth, inflation or resilience.
- Unemployment and poverty.
- Unemployment reached 33.3% in Q4 2020 under the old NBS definition (which counted people working under 20 hours a week as unemployed). The August 2023 methodology gives 5.3% for Q4 2022; the two series cannot be compared.
- Poverty rose from 40% (81 million people) in 2018/19 to 56% (113 million) in 2022/23.
6.5 Bola Ahmed Tinubu (29 May 2023 – present): shock therapy with costs up front
- Reforms and the immediate shock. The petrol subsidy ended at his inauguration, and the central bank unified the FX market on 14 June 2023. Dollar GDP per head halved to $1,084 in 2024. Headline inflation peaked at 34.80% in December 2024 (old CPI base), with food inflation at 39.84%.
- CPI rebasing. The January 2025 rebasing (base year 2024) reset headline inflation to 24.48%, easing to about 20% by August 2025. Part of that fall reflects the change of methodology, not just slower price rises.
- Real growth recovering.
- NBS real GDP growth: 3.38% (2024), 3.87% (2025), and 4.07% in Q4 2025.
- Real per-capita growth: about +1.9% in each of 2024 and 2025.
- Oil output recovered to about 1.6 million bpd in 2025.
- The 650,000 bpd Dangote refinery helped cut Q1 2025 petrol imports to $1.2 billion (₦1.76 trillion), from $2.6 billion (₦3.81 trillion) in Q1 2024.
- The IMF's October 2026 WEO projects 4.2% growth in 2026, nominal GDP per capita of about $1,594, and PPP per capita of about $10,051.
- Welfare has worsened so far. The World Bank's April 2026 Nigeria Development Update estimates poverty rose from 56% in 2023 to 61% in 2024 and 63% in 2025 (about 140 million people), and projects a decline to about 59% by 2028.
7. Scorecard: Transparent Criteria
Changes are measured between the calendar years in which each president took office and left office, so transition years are shared. Brent figures are annual EIA averages.
| Measure | Obasanjo | Yar'Adua | Jonathan | Buhari | Tinubu (to 2025) |
|---|---|---|---|---|---|
| Real GDP pc (PPP 2021$), start → end | 4,782 → 6,949 | 6,949 → 7,963 | 7,963 → 8,892 | 8,892 → 7,843 | 7,843 → 8,145 |
| Total change | +45.3% | +14.6% | +11.7% | −11.8% | +3.9% |
| Avg annual real pc growth | ~4.8% | ~4.6% | ~2.2% | ~−1.6% | ~1.9% |
| Current US$ pc, start → end | 481 → 1,816 | 1,816 → 2,202 | 2,202 → 2,586 (peak 3,089) | 2,586 → 2,139 † | 2,139 → 1,224 |
| Avg Brent | ~$42 | ~$77 | ~$102 | ~$62 | ~$77 |
| Avg crude output | ~2.2m bpd | ~2.2m bpd | ~2.4m bpd | ~1.8m bpd | ~1.5m bpd |
| Avg CPI inflation | ~12% | ~12–13% | ~11% | ~14% | ~27% |
| Recessions | None | None | None | 2016, 2020 | None |
† Buhari's dollar decline is understated, because the post-2019 data include the 41.7% rebasing uplift.
8. Verdict: Best and Worst, and How Confident We Can Be
8.1 Best: Obasanjo (high confidence)
His term had the fastest and largest rise in real income per head, the deepest structural reforms (telecoms, debt relief, bank consolidation, fiscal rules), and a large fall in public debt.
- Counter-argument: he started from a depressed post-military base, and oil prices more than doubled during his term.
- Rebuttal: oil averaged about $42, well below Jonathan's $102, yet he delivered roughly double Jonathan's per-capita growth. Debt relief and GSM liberalisation were policy choices with lasting effects.
- Yar'Adua matches him on pace, but over less than three years, largely on inherited momentum.
8.2 Worst: Buhari (high confidence on the outcome, moderate on how much was his fault)
He is the only president under whom real income per head fell over the full term, with about 12% lost.
- Strongest defence: he inherited the 2014–16 oil crash, and COVID hit during his second term. Both were external.
- Strongest critique:
- Per-capita income kept falling in 2017–19, when oil had recovered.
- The FX peg and multiple windows, central-bank deficit financing, import restrictions and the 2023 cash crunch were his administration's own choices.
- Oil theft cut output by roughly 40% from peak, so Nigeria largely missed the 2022 price spike.
- On balance: external shocks explain the recessions, but policy explains why there was no recovery in between.
8.3 Jonathan: underperformed his circumstances
He presided over the highest income levels Nigeria has recorded, but real per-capita growth was modest despite the best oil prices of any term, and the economy entered the 2014–15 oil crash with few buffers.
8.4 Tinubu: too early to rank
Currently mid-table on real growth, bottom on welfare indicators.
- Case for: the subsidy and FX reforms removed implicit subsidies worth more than 5% of GDP. Real per-capita growth has turned positive, oil output and refining capacity are recovering, and the IMF projects further gains.
- Case against: the reforms came with little cushioning. Inflation peaked at 34.8% (December 2024), poverty reached 63% (World Bank, 2025), and dollar income per head is at a 20-year low.
- His dollar figures mostly reflect a correction from an overvalued naira, not lost output. Judge him on the constant-PPP series and on poverty trends through 2027.
9. How to Use These Figures
- Comparing governments: use constant-price PPP or the real per-capita growth series. Never use nominal US$ or naira.
- Comparing with other countries: use current PPP for living standards, and US$ only for external capacity such as debt service and imports.
- Comparing years across 2019: in nominal series, check that figures before and after 2019 are on the same base year. Do not mix World Bank and IMF vintages.
- Assessing Tinubu: watch 2026–27 real per-capita growth (IMF projects about 2%), poverty (World Bank projects about 59% by 2028), and whether oil output and non-oil growth keep running above roughly 2.1% population growth.
10. Caveats
- Term attribution by calendar year is approximate. Presidents inherit momentum, and policy effects arrive with lags.
- Pre-2010 real data are back-cast from the 2014 rebasing, and the World Bank's nominal series have a 2019 break from the 2025 rebasing.
- Nigerian data quality is a known limitation. Unemployment and CPI methodologies changed in 2023 and 2025, so series before and after those changes cannot be compared.
- 2026 figures are IMF projections, not outturns, and depend on oil prices, which have been volatile through 2026.
- GDP per capita is an average. Poverty rose even in years when GDP per capita grew, because inflation hit lower-income households hardest.
11. Key Sources
- World Bank WDI – GDP per capita, PPP (constant 2021 int'l $)
- World Bank WDI – GDP per capita, PPP (current int'l $)
- World Bank WDI – GDP per capita (current US$)
- World Bank WDI – GDP per capita (current LCU)
- World Bank WDI – Official exchange rate
- World Bank WDI – GDP per capita growth
- World Bank – International Comparison Program (ICP 2021)
- US EIA – Nigeria country analysis (2025)
- 2014 Nigeria GDP rebasing (overview)
- Channels TV – 2025 GDP rebasing to ₦205tn
- Premium Times – Rebased 2024 GDP ₦372 trillion
- World Bank – Nigeria Development Update (2023)
- Al Jazeera – Oil exports at 25-year low due to theft (2022)
- Ripples Nigeria – Q1 2023 GDP and the cash crunch
- Vanguard – Inflation 24.48% after CPI rebasing
- Premium Times – Q4 2025 GDP growth 4.07%
- BusinessFront – World Bank poverty projections
Gemini
Nigeria’s GDP Per Capita (1999–2026): Fluctuations, Causes, and Presidential Performance
1. Overview and How to Read the Numbers
From 1999 to 2026, Nigeria’s economic story breaks into two distinct halves: 15 years of strong growth (1999–2014) followed by a decade of decline and currency shock (2015–2024), with early signs of stabilization appearing in 2025–2026.
Two quick explanations keep the numbers honest before comparing administrations:
1.1 Purchasing Power Parity (PPP) vs. Nominal USD
Purchasing Power Parity (PPP) in current ("nominal") international dollars measures how much local food, housing, and services an average Nigerian’s share of the economy can buy inside Nigeria. Nominal USD converts Nigeria’s output at the market exchange rate, showing what that same income can buy on the global market (imported goods, fuel, electronics, or travel). Because global prices rise over time, current PPP can slowly drift upward even when living standards are flat—so checking real (inflation-adjusted) PPP alongside both figures shows what ordinary people actually felt.
1.2 The July 2025 GDP Rebasing
In July 2025, Nigeria’s National Bureau of Statistics (NBS) updated its measuring stick from a 2010 base year to a 2019 base year, capturing previously undercounted sectors like real estate and informal trade. That lifted Nigeria’s measured GDP by 35% to 42%. The World Bank and IMF adjusted historical years upward to match the new ruler—so 2014’s nominal peak now reads $4,363 (instead of the older ~$3,100 figure) and 2026 stands near $1,556 (instead of under $1,000). The percentage rises and falls across presidents stay the same.
2. Performance by Presidential Administration (1999–2026)
The table below uses the consistent post-2025 rebased series from the World Bank (1999–2025) and IMF (2026 estimates). Because handovers take place in May, transition years reflect overlapping policies.
| President (Tenure) | Nominal USD (Start → End) | Nominal USD Change | Current PPP Int'l $ (Start → End) | Current PPP Change | Real PPP (2021 $) Trend |
|---|---|---|---|---|---|
| Olusegun Obasanjo (1999–2007) | $667 → $2,454 | +267.9% | $3,002 → $5,298 | +76.5% | Steep, steady climb from 1999 low ($4,782) |
| Umaru Musa Yar'Adua (2007–2010) | $2,454 → $3,161 | +28.8% | $5,298 → $6,301 | +18.9% | Continued upward momentum despite 2008 global crisis |
| Goodluck Jonathan (2010–2015) | $3,161 → $3,651 (Peak: $4,363 in 2014) | +15.5% (+38.0% to peak) | $6,301 → $7,308 (Peak: $7,396 in 2014) | +16.0% | Hit all-time historical peak of $8,892 in 2015 |
| Muhammadu Buhari (2015–2023) | $3,651 → $2,139 ($2,893 in 2022) | -41.4% (-20.8% to 2022) | $7,308 → $8,712 ($8,304 in 2022) | +19.2% (global inflation) | Fell -11.8% ($8,892 down to $7,843; low of $7,588 in 2021) |
| Bola Ahmed Tinubu (2023–2026 est.) | $2,139 → $1,556 (Low: $1,084 in 2024) | -27.3% (-49.3% in 2024) | $8,712 → $10,050 | +15.4% | Edging back up ($7,843 in 2023 → $8,145 in 2025) |
3. Historical Drivers of Each Major Shift
3.1 Olusegun Obasanjo (1999–2007): The Great Rebuild
- What happened: Both nominal dollar income and PPP surged faster than under any other leader. Real economic growth averaged over 6% to 9% a year (spiking to 15.3% in 2002).
- Why: Ending military rule lifted international sanctions and restored investor confidence. Crucially, the government opened up mobile telecoms (GSM in 2001), forced bank consolidation (2004–2005) so banks could fund real business, and negotiated the 2005–2006 Paris Club debt deal that erased roughly $18 billion in foreign debt. As global oil prices climbed, the government also saved surplus cash in the Excess Crude Account (ECA), building strong foreign reserves.
3.2 Umaru Musa Yar'Adua (2007–2010): Weathering the Global Storm
- What happened: Nominal USD jumped past $3,000 in 2008, dipped to $2,631 in 2009, and quickly bounced back to $3,161 in 2010. Current PPP never dropped at all.
- Why: The 2008–2009 Global Financial Crisis crashed oil prices and pushed the Naira down, causing the 2009 dip. However, Nigeria survived relatively unscathed because of the foreign reserves inherited from Obasanjo, a decisive 2009 Central Bank rescue of failing banks, and the 2009 Niger Delta Amnesty Program, which stopped pipeline bombings and restored oil exports.
3.3 Goodluck Jonathan (2010–2015): The All-Time Peak and Hidden Weakness
- What happened: Nigeria reached its highest living standard on record: nominal GDP per capita hit $4,363 in 2014, and inflation-adjusted PPP hit its all-time high of $8,892 in 2015.
- Why: Oil stayed above $100 per barrel for years, keeping the Naira stable (around ₦155–₦160/$) while non-oil industries like banking, telecoms, cement, and Nollywood expanded rapidly.
- The turning point (2014–2015): Despite record oil money, savings in the Excess Crude Account were heavily drawn down, fuel subsidy costs swelled, and oil theft plus Boko Haram violence grew. When global oil prices collapsed by half in late 2014, Nigeria had almost no savings cushion left, causing nominal income to drop sharply in 2015.
3.4 Muhammadu Buhari (2015–2023): The Long Slide
- What happened: Nigeria suffered its longest uninterrupted loss in real living standards since 1999. While nominal current PPP drifted up after 2021 due to global price inflation, real (inflation-adjusted) PPP fell from $8,892 in 2015 to $7,588 in 2021 and never recovered to its 2015 peak. Nominal USD sank from $3,651 to $2,893 by 2022 (and $2,139 in 2023).
- Why: Two recessions struck—2016 (low oil prices and renewed Niger Delta pipeline attacks) and 2020 (COVID-19 lockdowns, shrinking GDP by 6.4%). More damaging, however, were policy choices: the government defended an artificial exchange rate with multiple currency windows, banned 43 import items, closed land borders, spent trillions on petrol subsidies, and borrowed over ₦22 trillion directly from the Central Bank ("Ways and Means" money printing). Real GDP growth lagged behind population growth for years, meaning the economic pie shrank per person while inflation surged and banditry disrupted farming.
3.5 Bola Ahmed Tinubu (2023–Present): Shock Therapy and Early Recovery
- What happened: In 2024, Nigeria experienced its sharpest single-year collapse in nominal USD (-49.3%), crashing from $2,139 to $1,084. However, in 2025 ($1,223) and 2026 ($1,556 est.), dollar income began rebounding, and real PPP ticked upward from $7,843 (2023) to $8,145 (2025).
- Why: Inheriting depleted net foreign reserves and unsustainable subsidy bills, the administration immediately ended the fuel subsidy and floated the Naira in mid-2023. The Naira plunged from ~₦460/$ to over ₦1,500/$ in 2024 (before firming to around ₦1,355/$ by November 2026). Because dollar GDP divides Naira output by the exchange rate, that devaluation slashed nominal USD overnight and triggered painful food and transport inflation. On the production side, however, ending distortions helped real GDP growth speed up to roughly 4.0%–4.2% (2024–2026)—finally beating population growth again—alongside rebuilt foreign reserves ($43B–$46B by 2025), rising domestic fuel refining, and higher oil output.
4. Objective Verdict: Best and Worst Performing Governments
Judging objectively requires separating external luck (high or low oil prices) from policy management (how well a government built buffers, opened sectors, and grew output faster than population).
4.1 Best Performing Government: Olusegun Obasanjo (1999–2007)
- Why: Obasanjo did not merely ride rising oil prices—his administration transformed the rules of the economy so private businesses could grow. Telecoms liberalization, banking reform, pension reform, debt cancellation, and fiscal savings (the Excess Crude Account) produced a 268% rise in nominal USD and a 76.5% rise in PPP, while leaving his successor a clean balance sheet and large foreign reserves.
- Why not Jonathan or Yar'Adua? Yar'Adua deserves strong credit for protecting stability during a global crash and securing peace in the Niger Delta, while Jonathan delivered the highest peak dollar and real PPP wealth in Nigeria's history. Yet Jonathan ranks behind Obasanjo because his administration spent through a historic oil boom without saving enough reserves or fixing structural leaks—leaving the country vulnerable the moment oil prices fell in late 2014.
4.2 Worst Performing Government: Muhammadu Buhari (2015–2023)
Across eight full years, the average Nigerian grew genuinely poorer in real purchasing power. Rather than adjusting early to lower oil revenues, his administration relied on artificial exchange rates, import bans, massive fuel subsidies, and Central Bank money printing. Those choices choked off investment, drove up debt servicing, hollowed out real reserves, and built up the macroeconomic crisis that exploded in 2023.
4.3 Where Bola Ahmed Tinubu Stands Today
On immediate household pain and dollar-value collapse, Tinubu’s 2023–2024 period produced the harshest sudden drop since 1999. Objectively, however, two factors prevent ranking his tenure worse than Buhari’s so far:
- Floating the Naira and ending fuel subsidies exposed hidden losses that had been building for years rather than creating them from scratch.
- By 2025–2026, real economic growth (~4%+) and real PPP per capita have returned to positive growth per person, with nominal USD recovering toward $1,556.
Because Tinubu is still in office, his final verdict remains unfinished—it depends on whether stabilizing currency and reserves translates into lower inflation, cheaper power, and real wage growth for ordinary citizens.
5. Year-by-Year GDP Per Capita Data (1999–2026)
This table provides the annual figures behind the trend from 1999 through 2026 (World Bank rebased historical data and IMF 2026 estimates).
| Year | President | Nominal USD | Current PPP (Int'l $) | Key Historical Driver |
|---|---|---|---|---|
| 1999 | Obasanjo | $667 | $3,002 | Return to democracy; sanctions lifted |
| 2000 | Obasanjo | $765 | $3,139 | Post-military economic stabilization |
| 2001 | Obasanjo | $801 | $3,309 | GSM mobile telecoms liberalization |
| 2002 | Obasanjo | $1,000 | $3,770 | Strong 15.3% real GDP surge |
| 2003 | Obasanjo | $1,064 | $4,015 | NEEDS reform program begins |
| 2004 | Obasanjo | $1,310 | $4,381 | Banking consolidation and Excess Crude Account launched |
| 2005 | Obasanjo | $1,656 | $4,678 | Paris Club debt relief deal agreed |
| 2006 | Obasanjo | $2,113 | $4,975 | $18B foreign debt cleared; rising oil prices |
| 2007 | Obasanjo / Yar'Adua | $2,454 | $5,298 | First democratic handover; strong reserves |
| 2008 | Yar'Adua | $3,002 | $5,607 | Global oil boom peaks at $147/barrel |
| 2009 | Yar'Adua | $2,631 | $5,927 | Global Financial Crisis dip; CBN bank rescue and Niger Delta Amnesty |
| 2010 | Yar'Adua / Jonathan | $3,161 | $6,301 | Oil output rebounds post-amnesty; 8.0% real growth |
| 2011 | Jonathan | $3,451 | $6,585 | $100+ oil boom; strong services and banking growth |
| 2012 | Jonathan | $3,734 | $6,671 | Partial fuel subsidy standoff; non-oil expansion |
| 2013 | Jonathan | $4,059 | $7,004 | Sustained $100+ oil and Naira stability |
| 2014 | Jonathan | $4,363 | $7,396 | All-time nominal USD peak ($4,363); oil crash begins late year |
| 2015 | Jonathan / Buhari | $3,651 | $7,308 | Oil price slump hits exports; real PPP reaches historical peak ($8,892) |
| 2016 | Buhari | $2,918 | $7,072 | Recession (-1.6%); Naira devalued; pipeline militancy |
| 2017 | Buhari | $2,642 | $7,037 | Slow exit from recession; multiple FX windows |
| 2018 | Buhari | $2,898 | $7,158 | Oil recovery lifts USD GDP; growth lags population |
| 2019 | Buhari | $3,190 | $7,551 | Land border closure; 2019 becomes new NBS rebasing benchmark |
| 2020 | Buhari | $2,798 | $7,415 | COVID-19 pandemic recession (-6.4%) and oil crash |
| 2021 | Buhari | $2,789 | $7,588 | Real PPP hits post-2015 low; heavy CBN Ways and Means borrowing |
| 2022 | Buhari | $2,893 | $8,304 | High oil prices offset by oil theft and massive fuel subsidies |
| 2023 | Buhari / Tinubu | $2,139 | $8,712 | May handover: fuel subsidy removed and Naira floated |
| 2024 | Tinubu | $1,084 | $9,100 | Naira devaluation cuts nominal USD by 49%; high inflation |
| 2025 | Tinubu | $1,223 | $9,532 | NBS GDP rebasing; reserves rebuild; real growth hits 4.0% |
| 2026 (est.) | Tinubu | $1,556 | $10,050 | IMF estimate: FX stabilizes (~₦1,355/$); 4.2% real growth |
6. Further Viewing
For a visual breakdown of how exchange rate shocks and policy shifts drove Nigeria’s sharp dollar decline from its 2014 peak, watch How Nigeria's GDP Per Capita Went From $4,363 to $1,600.
Perplexity
Nigeria’s GDP per Capita Since 1999: Purchasing Power, Presidential Records and Economic Turning Points
1. Executive Assessment
On growth in inflation-adjusted output per person, Obasanjo has the strongest record since 1999, while Buhari has the weakest. That is a defensible ranking of economic outcomes—not proof that presidents alone caused those outcomes. Oil prices, inherited policies, population growth, global crises and statistical revisions all matter.
Calculations from the World Bank’s real purchasing-power-parity series show approximately 45% growth between the 1999 and 2007 annual observations, compared with a 12% decline between 2015 and 2023. These are annual-observation comparisons, not exact inauguration-day measurements.
[1]The accompanying three-panel chart plots the fluctuations, with presidential tenures shaded. The chart is supplied as an image and PDF, alongside the annual data and calculation tables. Completed annual observations run through 2025; available 2026 IMF forecasts are marked separately rather than presented as realised outcomes.
[1][2][3]2. Understanding the Three Measures
The request for GDP per capita “in purchasing power parity, but in nominal naira or dollars” brings together measurements that answer different questions. To avoid a misleading interpretation, the chart includes three separate series.
| Measure | What it tells us | Main limitation |
|---|---|---|
| GDP per capita at PPP, in current international dollars | The current-price value of output per person, adjusted for differences in countries’ price levels. | Its rise over time includes price changes; it is not a clean measure of real improvement. |
| GDP per capita at PPP, in constant 2021 international dollars | Inflation-adjusted output per person, expressed on a common purchasing-power basis. | The most useful of these three measures for comparing real growth over time, but still subject to statistical revisions. |
| GDP per capita in current US dollars | Output per person converted into dollars using the exchange-rate basis used in the accounts. | Highly sensitive to naira depreciation and exchange-rate arrangements. |
2.1. International Dollars Are Not Spendable US Dollars
An international dollar is a purchasing-power unit, not a US dollar that a Nigerian can exchange or spend abroad. Consequently, “PPP in nominal dollars” is properly described as GDP per capita at PPP in current international dollars. Converting that figure back through its PPP conversion factor yields nominal naira GDP per capita; it does not produce a separate, inflation-proof “PPP naira” measure.
[4][5]2.2. Which Measure Should Be Used to Judge Governments?
For comparing governments’ records on real output per person, the central panel—GDP per capita at constant 2021 PPP prices—deserves the greatest weight. The nominal-dollar panel remains important, but it answers a different question: how much the economy’s output is worth when translated into foreign currency.
This distinction helps explain how Nigeria can record modest growth in real output per person while simultaneously experiencing a sharp fall in nominal-dollar GDP per capita.
[1][2]3. Selected Annual Figures, 1999–2025
The following are selected observations from the plotted series. Figures are rounded.
| Year | President during the year | Current PPP international dollars | Constant 2021 PPP international dollars | Current US dollars |
|---|---|---|---|---|
| 1999 | Abdulsalami → Obasanjo | 3,002 | 4,782 | 481 |
| 2007 | Obasanjo → Yar’Adua | 5,298 | 6,949 | 1,816 |
| 2010 | Yar’Adua → Jonathan | 6,301 | 7,963 | 2,202 |
| 2014 | Jonathan | 7,396 | 8,885 | 3,089 |
| 2015 | Jonathan → Buhari | 7,308 | 8,892 | 2,586 |
| 2019 | Buhari | 7,551 | 8,362 | 3,190 |
| 2020 | Buhari | 7,415 | 7,664 | 2,797 |
| 2022 | Buhari | 8,305 | 7,752 | 2,899 |
| 2023 | Buhari → Tinubu | 8,705 | 7,843 | 2,139 |
| 2024 | Tinubu | 9,087 | 7,994 | 1,084 |
| 2025 | Tinubu | Approximately 9,532 | 8,145 | 1,224 |
Sources: World Bank WDI for real PPP and nominal US dollars; the World Bank series republished by UNdata for current PPP through 2024; and a later WDI republication for current PPP in 2025. These current-PPP vintages differ slightly, so small differences should not be interpreted as economically meaningful.
[1][2][6][7]4. The Main Patterns in the Charts
4.1. Substantial Real Growth Before 2015
Real output per person rose substantially from 1999 to 2014–15. On the retrieved series, the 2025 level was approximately 70% above the 1999 level.
[1]4.2. A Lost Decade Relative to the Previous Peak
Nigeria subsequently lost ground. Real PPP GDP per capita in 2025 remained approximately 8.4% below its 2015 peak. A higher current-PPP figure therefore does not establish that Nigeria had recovered its earlier level of real output per person.
[1]4.3. The Nominal-Dollar Fall Was Not an Equivalent Production Collapse
The huge nominal-dollar decline in 2023–24 was not a comparable collapse in physical production. Real output per person rose modestly in the retrieved series while dollar-valued output fell sharply—a divergence dominated by currency repricing.
[1][2][8]4.4. The 2026 Figures Are Forecasts
The IMF’s October 2026 outlook puts current-PPP GDP per capita at approximately 10,050 international dollars and nominal GDP per capita at approximately US$1,590. As of 21 November 2026, these remain full-year forecasts rather than completed-year outcomes.
[3]5. Obasanjo, 1999–2007: Recovery, Oil Conditions and Structural Reforms
5.1. What Changed?
The real per-capita series rises from approximately 4,782 to 6,949 international dollars between the 1999 and 2007 observations. The explanation is not simply that oil prices increased. The World Bank identifies both favourable oil conditions and reforms that improved macroeconomic stability and private-sector confidence.
[1][9]5.2. The Principal Policy Channels
- Telecommunications liberalisation opened a previously constrained sector to private investment and competition.
- Banking consolidation and pension reform strengthened financial institutions and expanded financial intermediation.
- Improved oil-revenue management, particularly the oil-price-based fiscal rule, supported the saving of some windfall receipts.
- Paris Club debt relief in 2005–06 reduced the debt overhang and debt-service pressures. [9][10][11]
These policies reinforced one another: better fiscal management reduced instability, debt relief improved the sovereign balance sheet, and sectoral reforms opened investment opportunities.
5.3. Attribution and Limitations
Obasanjo benefited from a low starting point and an increasingly favourable oil environment. Nevertheless, the World Bank’s evaluation specifically credits his second-term administration with stronger economic management and reform leadership.
[12]6. Yar’Adua, 2007–2010: Continued Growth During Global Financial Turbulence
6.1. Real Growth and Dollar-Valuation Volatility
Between the 2007 and 2010 observations, real PPP GDP per capita rose by approximately 14.6%. Yet nominal-dollar GDP per capita fell from approximately US$2,154 in 2008 to US$1,820 in 2009, before recovering in 2010. This illustrates why dollar-valued GDP and domestic real production must be separated.
[1][2]6.2. Inherited Momentum Matters
Yar’Adua’s period fell within the broader 2001–10 expansion. The World Bank attributes that decade’s performance to the oil cycle, sounder macroeconomic policies, and banking and telecommunications reforms. Much of the productive momentum therefore predated his presidency; it would be excessive to credit all continuing growth to new initiatives under his government.
[9]His short tenure also makes a clean comparison difficult. The 2010 annual observation includes Jonathan’s period as acting president and president.
7. Jonathan, 2010–2015: Continued Expansion Followed by the Oil Shock
7.1. Growth Continued, but Slowed
Real output per person continued to grow, although more slowly than in the earlier expansion. The retrieved series rises from approximately 7,963 in 2010 to 8,885 in 2014 and then barely changes in 2015.
[1]The World Bank describes 2001–14 as a prolonged period of rising private consumption, supported by relatively high oil prices, investment, remittances and confidence following earlier reforms. That environment supported domestic demand and non-oil activity.
[9]7.2. The Turning Point in 2014
The turning point was the oil-price collapse beginning in 2014. Lower oil receipts weakened government finances and foreign-exchange availability, exposing the economy’s continuing dependence on petroleum earnings. The shock began under Jonathan and continued under Buhari; it cannot fairly be assigned wholly to either president.
[13]7.3. The Central Weakness: Insufficient Resilience
Jonathan’s central weakness in this comparison is not an absence of growth. It is that the expansion did not leave Nigeria sufficiently insulated from the next oil downturn. The vulnerability was structural: oil represented a relatively small share of production but dominated export earnings and government revenue.
[13]8. Buhari, 2015–2017: Oil Shocks, Production Disruptions and Policy Distortions
8.1. The First Sustained Reversal
The first sustained reversal appears after 2015. Real PPP GDP per capita fell in both 2016 and 2017.
[1]8.2. The Interacting Causes
- The international oil-price collapse reduced export earnings and fiscal resources.
- Domestic oil production declined, including disruptions from militant attacks and vandalism.
- Foreign-exchange constraints transmitted the oil shock into non-oil businesses.
- Policy implementation weaknesses and exchange-market distortions damaged confidence and economic activity. [9][13][14]
8.3. Separating the Shock from the Response
Buhari did not cause the global oil-price collapse. However, the World Bank’s assessment is that inadequate policy implementation and foreign-exchange distortions worsened the economic environment. The distinction between the external shock and the domestic policy response is essential to a fair assessment.
[9]9. Buhari, 2017–2019: Aggregate Recovery Without Per-Capita Recovery
9.1. Positive GDP Growth Was Not Enough
Aggregate GDP resumed growing, but growth was too weak to generate sustained gains per person. The real PPP series declines slightly from approximately 8,397 in 2017 to 8,362 in 2019.
[1]The relationship is:
Real GDP-per-capita growth = [(1 + real GDP growth) ÷ (1 + population growth)] − 1.
A country can report positive GDP growth while its average output per resident stagnates or falls. The World Bank described Nigeria’s recovery as weak, with aggregate growth around 2% in 2019.
[13]9.2. Why the Nominal-Dollar Jump in 2019 Is Misleading
The conspicuous nominal-dollar jump in 2019 requires a separate warning. The nominal series incorporates a change in statistical coverage associated with the new national-accounts base. It should not be read as a sudden improvement in household income or production during that year. The IMF reports that the later rebasing increased measured 2024 nominal GDP by approximately 34%.
[2][8]10. Buhari, 2020–2022: Pandemic Contraction and Incomplete Recovery
10.1. The Pandemic Shock
COVID-19 delivered another major external shock through mobility restrictions, lower oil prices, capital outflows and weaker remittances. The World Bank described the 2020 recession as Nigeria’s deepest in four decades, while also crediting some government measures with cushioning the contraction.
[15]10.2. Recovery Did Not Restore the Earlier Peak
The real PPP series falls sharply in 2020, remains weak in 2021 and begins recovering in 2022. However, the level remained well below 2015.
[1]10.3. Statistical Revisions Affect Comparisons
Older reports and newer rebased accounts do not always show identical growth rates. The chart uses one retrieved real-PPP series consistently rather than splicing together annual growth rates from different national-accounts vintages.
11. Tinubu, 2023–2026: Currency Adjustment, Household Hardship and Macroeconomic Stabilisation
11.1. Two Developments Occurred Together
- Foreign-exchange liberalisation and naira depreciation sharply reduced nominal-dollar GDP per capita.
- Real output per person increased modestly in the available annual series. [1][2][8]
11.2. Reform Benefits and Adjustment Costs
Fuel-subsidy reform and exchange-rate adjustment addressed longstanding distortions, but imposed substantial short-term costs. The World Bank reports that households continued to face high poverty and food insecurity. It also stresses that recent adjustment costs compounded earlier policy weaknesses and external shocks.
[16][17]The IMF’s 2026 assessment credits reforms with stronger macroeconomic stability, improved foreign-exchange-market functioning and rebuilt external buffers. However, it also reports persistent hardship, limited cash-transfer support and important fiscal-management weaknesses. In particular, it cautions that estimated subsidy savings had not clearly accrued to the 2025 budget.
[8]11.3. What Cannot Yet Be Claimed
Neither “dollar GDP collapsed, so production collapsed” nor “macroeconomic stability improved, so household welfare improved” is a sufficient account of Tinubu’s record. The available evidence distinguishes modest real per-capita growth and stronger macroeconomic indicators from the continuing difficulty of translating those gains into better living standards.
[1][8][17]12. Comparing Presidential Records on a Consistent Basis
12.1. Method and Transition-Year Limitations
The table below uses annual observations around presidential transitions as proxies. These are not inauguration-day measurements: 2007, 2010, 2015 and 2023 each contain more than one administration. Annualised growth adjusts for different period lengths, but cannot remove inherited momentum or external shocks.
| Government | Annual-observation window | Real PPP GDP per capita: start → end | Cumulative change | Annualised change |
|---|---|---|---|---|
| Obasanjo | 1999–2007 | 4,782 → 6,949 | +45.3% | +4.8% |
| Yar’Adua | 2007–2010 | 6,949 → 7,963 | +14.6% | +4.6% |
| Jonathan | 2010–2015 | 7,963 → 8,892 | +11.7% | +2.2% |
| Buhari | 2015–2023 | 8,892 → 7,843 | −11.8% | −1.6% |
| Tinubu, incomplete tenure | 2023–2025 | 7,843 → 8,145 | +3.9% | +1.9% |
Calculations use the World Bank real-PPP series. The close annualised comparison between Obasanjo and Yar’Adua should not be overinterpreted because of Yar’Adua’s short tenure and the mixed transition years.
[1]12.2. Best Record: Obasanjo
Obasanjo has the strongest overall case because his period combines substantial real per-capita growth with identifiable reforms that improved productive opportunities and the public balance sheet. Telecommunications liberalisation, banking and pension reforms, debt relief and oil-revenue management make the policy case stronger than a growth number alone.
[9][10][12]This is not a claim that his government solved poverty, infrastructure or governance problems. It is a narrower conclusion: among these administrations, his has the strongest combination of measured per-capita expansion and documented growth-supporting reforms.
12.3. Weakest Record: Buhari
Buhari has the weakest record on the requested measure because real output per person ended substantially below its starting level, after eight years encompassing recession, stagnation and an incomplete recovery.
[1]A fair judgment must acknowledge both major external shocks—the inherited oil downturn and COVID-19. However, the weak recovery before COVID-19, together with documented exchange-market distortions and policy-implementation problems, means the record cannot be explained by bad luck alone.
[9][13]12.4. Tinubu: An Incomplete Record
Tinubu’s available real per-capita record is positive but modest. His macroeconomic reforms have documented benefits, yet household hardship and fiscal weaknesses prevent equating stabilisation with broad prosperity. His unfinished tenure should not be ranked as though projected benefits have already materialised.
[1][8][17]13. What This Ranking Establishes—and What It Does Not
13.1. GDP per Capita Is Not Typical Household Income
GDP per capita measures average production, not the income received by a typical Nigerian. An administration can increase it while gains remain concentrated, food becomes less affordable or public services deteriorate.
13.2. A Broader Government-Performance Scorecard
A comprehensive assessment would also examine:
- Real household consumption.
- Poverty and the distribution of economic gains.
- Median earnings and employment quality.
- Food affordability.
- Security.
- Public-service delivery.
- Fiscal sustainability.
The World Bank’s recent work explicitly distinguishes improving macroeconomic indicators from improvements in livelihoods.
[17][18]13.3. Overall Conclusion
Nigeria experienced substantial per-capita expansion before 2015, lost ground over the following years, and had not regained its previous real-PPP peak by 2025. Obasanjo leads this growth comparison; Buhari trails it. Attributing the exact size of either outcome to presidential policy requires more than the time-series chart alone.
[1]Sources
[1] NY.GDP.PCAP.PP.KD https://api.worldbank.org/v2/country/NGA/indicator/NY.GDP.PCAP.PP.KD?format=json&per_page=200&source=2
[2] NY.GDP.PCAP.CD?format=json https://api.worldbank.org/v2/country/NGA/indicator/NY.GDP.PCAP.CD?format=json
[3] Nigeria https://www.imf.org/external/datamapper/profile/NGA
[4] api.worldbank.org https://api.worldbank.org/v2/indicator/NY.GDP.PCAP.PP.CD?format=json
[5] Nigeria GDP per capita, PPP - data, chart - TheGlobalEconomy.com Nigeria GDP per capita, PPP - data, chart | TheGlobalEconomy.com
[6] UNdata | record view | GDP per capita, PPP (current … UNdata | record view | GDP per capita, PPP (current international $)
[7] Nigeria GDP per Capita (PPP, Current International $) (2025) Nigeria GDP per Capita (PPP, Current International $) (2025) — Apiar Data
[8] Nigeria: 2026 Article IV Consultation-Press Release; Staff … https://www.elibrary.imf.org/view/journals/002/2026/125/article-A001-en.xml
[9] Nigeria Country Economic Memorandum https://documents1.worldbank.org/curated/en/099020012132216124/pdf/P1761970c336260ce0bd0e0ebd98a53275d.pdf
[10] Nigeria Competitiveness and Growth - Country Economic Memorandum https://documents1.worldbank.org/curated/en/280651468289181358/pdf/364830v2.pdf
[11] Nigeria’s Economic Reforms - Progress and Challenges https://www.brookings.edu/wp-content/uploads/2016/06/20070323okonjo_iweala.pdf
[12] Publication: Nigeria - Country Assistance Evaluation https://openknowledge.worldbank.org/entities/publication/f9546ec9-2a02-592e-a22e-1753c529e9af
[13] Nigeria Development Update (NDU) Nigeria Development Update (NDU)
[14] nigeria - bi-annual economic update: fragile recovery https://documents1.worldbank.org/curated/en/349511494584937819/pdf/114996-WP-P163291-PUBLIC-NEUNoFinalfromPublisher.pdf
[15] Nigeria Economic Update: Resilience through Reforms Nigeria Economic Update: Resilience through Reforms
[16] Nigeria Development Update https://thedocs.worldbank.org/en/doc/6cdd609ccd14ef89ecf764be228c9ec4-0360012025/original/ndu-october-2025-presentation.pdf
[17] Positive Economic Momentum in Nigeria, Now Time to Bring Home … Positive Economic Momentum in Nigeria, Now Time to Bring Home the Gains
[18] World Bank Document https://openknowledge.worldbank.org/server/api/core/bitstreams/afbf7252-27a4-447d-b047-442b3796ba17/content
Grok
1. Overview of Nigeria’s GDP per Capita (PPP) from 1999 to 2024
Nigeria’s GDP per capita in purchasing-power-parity terms (current international dollars) rose from approximately $3,000 in 1999 to about $9,087 in 2024, according to World Bank data. The strongest sustained gains occurred during the 2000s oil boom. After 2014 the series became more volatile, with a plateau, a dip, and later recovery. Population growth of roughly 2–2.5 percent per year continuously erodes per-person gains. Nigeria’s heavy dependence on oil means global crude prices, production volumes, fiscal and monetary policy, and external shocks explain most large movements.
2. Historical Data Series (Current International $)
Approximate annual figures (World Bank / UN sources; minor revisions occur across data releases):
- 1999: ~3,002
- 2000: ~3,139
- 2001: ~3,309
- 2002: ~3,770
- 2003: ~4,015
- 2004: ~4,381
- 2005: ~4,678
- 2006: ~4,975
- 2007: ~5,298
- 2008: ~5,607
- 2009: ~5,927
- 2010: ~6,301
- 2011: ~6,585
- 2012: ~6,671
- 2013: ~7,004
- 2014: ~7,396 (near-peak in many series)
- 2015: ~7,308
- 2016: ~7,072
- 2017: ~7,037
- 2018: ~7,158
- 2019: ~7,551
- 2020: ~7,415
- 2021: ~7,588
- 2022: ~8,305
- 2023: ~8,705
- 2024: ~9,087
Constant-price PPP series (different base years) show a similar qualitative pattern: strong rise to the mid-2010s, followed by a more pronounced dip and partial recovery. Nominal U.S.-dollar per-capita figures are far more volatile because of naira depreciation.
3. Periods by Ruling President and Drivers of Major Changes
3.1 Olusegun Obasanjo (May 1999 – May 2007)
Steady, strong rise from roughly $3,000 to $5,300. Oil prices recovered and then entered a sustained boom. Banking, telecom (GSM revolution), and pension reforms took hold. Macroeconomic management improved and Paris Club debt relief sharply reduced external debt. Average real GDP growth was high (approximately 6–7 percent).
3.2 Umaru Musa Yar’Adua (May 2007 – May 2010)
Continued rise from about $5,300 to $6,300. Oil prices remained elevated before and after the global financial crisis. Niger Delta amnesty efforts helped stabilize production. Average growth rates were among the highest of the democratic era (around 7 percent). The short tenure limited longer-term structural impact.
3.3 Goodluck Jonathan (May 2010 – May 2015)
Further gains that reached the mid-2010s peak (approximately $6,300 to $7,400 in 2014). Oil prices stayed high for most of the period, supporting large revenues. The 2014 GDP rebasing increased the measured size of the economy. Growth remained positive but slowed later. Insecurity (especially Boko Haram) and governance concerns rose. The global oil-price collapse began in late 2014.
3.4 Muhammadu Buhari (May 2015 – May 2023)
Plateau, decline, then partial recovery with high volatility (roughly $7,300 down below $7,100, then recovery into the $7,500–8,300 range). The oil-price crash (from above $100 to $30–50) plus production shortfalls produced the 2016 recession. Multiple exchange-rate regimes, border closures, and the 2020 COVID-19 shock compounded the damage. Real per-capita growth was weak or negative for extended stretches. Average real GDP growth was the lowest of the Fourth Republic period.
3.5 Bola Tinubu (May 2023 – present)
Continued rise in current-PPP terms into 2024 (approximately $8,700 to $9,100). Fuel-subsidy removal and exchange-rate unification caused sharp naira depreciation, elevated inflation, and short-term hardship. Early growth data show recovery, but a full evaluation requires additional years of evidence.
4. Objective Assessment: Best and Worst Performing Governments
4.1 Best Overall Performance
Olusegun Obasanjo (with Yar’Adua close behind on pure growth rates). The period delivered a sustained multi-year rise from a low base, structural reforms that expanded non-oil sectors (telecom, banking), debt relief that improved fiscal space, and an oil windfall that was at least partially converted into reserves and growth. Average real GDP growth was high and per-capita gains were durable within the boom window. Jonathan also produced solid absolute gains while oil prices were elevated, but the period ended with the onset of the price collapse and less visible progress on diversification.
4.2 Worst Overall Performance
Muhammadu Buhari. This is the only extended period that shows a clear multi-year stall or decline after the mid-2010s peak, two recessions (2016 and 2020), the weakest average real GDP growth, and per-capita income that failed to regain the earlier peak in real terms for years. The external oil shock was severe, yet policy rigidities (multiple foreign-exchange windows, delayed adjustments), insecurity that disrupted production, and limited diversification amplified the damage. Population growth meant living standards for many stagnated or fell.
These rankings rest on the GDP-per-capita-PPP series and associated growth rates. Other dimensions—security outcomes, corruption perceptions, inequality, human-development indicators, debt trajectory, or short-term hardship from reforms—can produce different conclusions. Oil-price cycles dominate the numbers; governments that reformed during upswings or absorbed shocks with greater policy flexibility performed better on this particular metric. Structural oil dependence, insecurity, and weak institutions remain the binding constraints across all administrations.